What is a Flowchart, Flowchart Symbols, Flow Chart Examples
Table of Contents
What is a Flowchart?
Flowchart- A Flowchart is the pictorial representation of the program/algorithm that uses different types of boxes; each box in a Flowchart denotes a specific instruction of the program/algorithm. Actual instructions of a program or the Algorithm are written in the form of boxes that clearly explains the whole purpose of the algorithm/program. These boxes are connected together using the solid lines or the lines that have arrow marks at one end which clearly shows the direction flow of the operation. This direction flow shows the sequence in which the instructions are executed.
Prior to the practical programming, an algorithm is first represented in the flow chart, which helps the programmer, designer, or developer to fully understand the whole structure of the algorithm/program. Finally, the flowchart is then expressed in any programming language like c/c++, visual basics, C#, etc.
We can define a Flowchart as the directional representation of the logic. A flowchart is basically not concerned with the detail of the logic but it simply shows the main theme of the algorithm or program. In a more simplified way we can say, a flowchart helps the programmer in logic development.
Just like a civil engineer makes a drawing of the house or a building before starting the actual construction. A programmer develops a flowchart before he/she starts the actual programming as the flowchart provides a complete road map to the programmers. The programmers can easily develop the programs by following the steps expressed in the Flow chart.
I myself, whenever I think of a new project, I usually sit and think for an hour or two and start asking myself some questions.
Why am I making this project?
Which hardware components I will need?
How all the components will be connected?
How I will read sensors and make certain decisions “Programming”?
Let me explain this with the help of an example. Let’s say I want to work on a soil moisture monitoring system, which can automatically turn ON and turn OFF the Water Pump.
The first question, Why am I making this project?
I want to make an automatic plants watering system. Whenever the soil gets dry the controller turns on the water pump automatically, and whenever the soil has the enough moisture/water the water pump is turned OFF automatically.
The 2nd question, which hardware components I will need?
For this project I will need a controller board Arduino Uno, or Arduino Nano, or Arduino Mega, or any other controller board. But I will go for the Arduino Uno. I will also need a soil moisture sensor, A relay Module, 12v DC water Pump, 12v Adaptor, and some connection wires.
The third question is, how all the components will be connected?
This usually consists of a circuit diagram. Which you have to make. Let’s say the circuit diagram is also ready, you are satisfied with all the connections.
Final step is the programming. But before the programming Flowcharts are developed. Right now I have things going on in my mind about the program/algorithm. Like
- First I will initialize pins for the soil Moisture sensor and relay module to control the water pump.
- I will declare some variables for storing the soil moisture value.
- I will go through basic setup, in which I will tell the controller which pins are the input and which pins are the output. What is the baud rate etc.
- Some conditions to check the soil moisture, if the soil moisture is greater then turn OFF the motor and if the soil moisture is less then turn ON the motor, otherwise do nothing and keep reading the soil moisture.
So this is basically the logic development. Now if I write the above things in the pictorial/boxes form this will become the flowchart.
This is really a good programming practice to first develop the flow charts and then start working on the programming. This way you won’t forget anything. Above is the flowchart of the soil moisture monitoring system. We will explain everything in detail.
Advantages and Disadvantages of a Flowchart:
Flowchart Advantages:
- flow chart is very simple to express the logic of the algorithm.
- Provide flow of operation in very simple manner.
- Provide a complete lay out of the algorithm to program.
- Each box contains clear information of the logic to be executed at each step.
- Easy to find start and end point of the algorithm.
- Result of the algorithm can be generated with dry run using flow chart.
- Error can be reduced while drawing flow chart.
- Provide flexibility for modification in the algorithm to add or remove any function.
Flowchart Disadvantages:
- Difficult to understand each symbol process.
- Instruction written in the symbol some time very difficult to understand due to its conciseness.
- Error at any step may result wrong direction of the flow.
- Wrong entry in any symbol result wrong logic representation of the algorithm.
To avoid any mistakes you should know about the flowchart symbols.
Flow chart symbols:
As discussed that flow chart Is basically the combination of the different symbols and each symbol in the flow chart has its own functionality . these symbols are given as under:
-
Terminal:
As its name shows it is used to represent the beginning (START), Pause(HALT) and ending(STOP) function in the program logic flow. When we start flow chart it is the first symbol which we enter into our flow chart if program use calls for a pause where pause statement calls normally in a program in some sort of the error condition then for that logic terminal also uses in addition terminal use to end any flow chart logic in other words we can say that terminal is the end to end flow chart logic with error conditions. We can also use a circle in the beginning.
-
input/output:
the input/output symbol is use to denote any function of an input/output device in the program logic. If program contains any function which is use to take data as input from an input device then input/output symbol use to represent the function. Data taken by the input/output symbol will provide in the program for further execution.
Data can be input from terminal disk magnetic tap card reader or any input device that step will be indicated in input/output symbol in flow chart. In addition this symbol also uses to represent the output instructions of the algorithm in the flow chart. Output of the program may be taken from the execution process step or printer terminal screen or any other output device.

-
Process:
This symbol contains all the arithmetic and data movement instructions in the flow chart. All arithmetic functions addition subtraction multiplication division etc. while in case of data movement logical processing symbols denote logical data movement from one main memory location to another location. in a special case when we have more then one arithmetic instruction or data moving instruction which has to be performed more than once and continuously then these instruction placed in same process symbol box and they are assumed to be executed in the order of their experience.

-
Flow lines:
Flow line are with arrow head and are used to indicate the direction of the operation were direction of the operation means it shw the exact sequence in which the instruction will execute. Normal flow of the flow chart is from top to bottom and left to right. Arrow head are required only when the normal top to bottom flow not to be followed. But good drawing practices tell that fin a flow line will be with arrow heads.
A main advantage of using arrow heads is that it avoids the ambiguity from the program. Another point of the good drawing practice is that flow lines do not cross each other and such kind of intersection must be avoided.
-
Decision:
A decision symbol is used in a flow chart to show a point where a decision has to be taken and as a result of the decision a branch to one or more than one alternative point is possible. In a decision path all the possible exit paths must be defined clearly. Some of the decision symbols are given as under:
-
Two way branch

There are two possible exit path of the decision if decision instruction condition result true which means that A>B then flow will follow in downward direction if given condition result false then data flow will follows path right to the decision symbol .flow line at the top of the decision symbol indicates that data enters in the decision symbol from that this path.
-
Three way branch:

-
Multiple-way branch

Examples of flow charts:
Now that you know about the different symbols, now I am going to share with you some flowchart examples to help you understand how data flows from one direction to the other during a process. In flow chart examples you will able to learn direction of data in two or more options. Flow chart contains more than one path for a single data to either take one path or the other path This process of data flow continues from start to end. Some of the flow charts are given as under:
How to make Arduino led blink flowchart
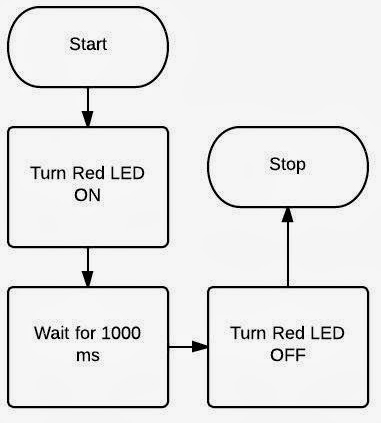
This is the simplest flow chart. Let’s explain this. When the program starts, an LED is turned ON, which remains ON for 1000 milliseconds “1 second” and then turns off, and finally, the program ends.
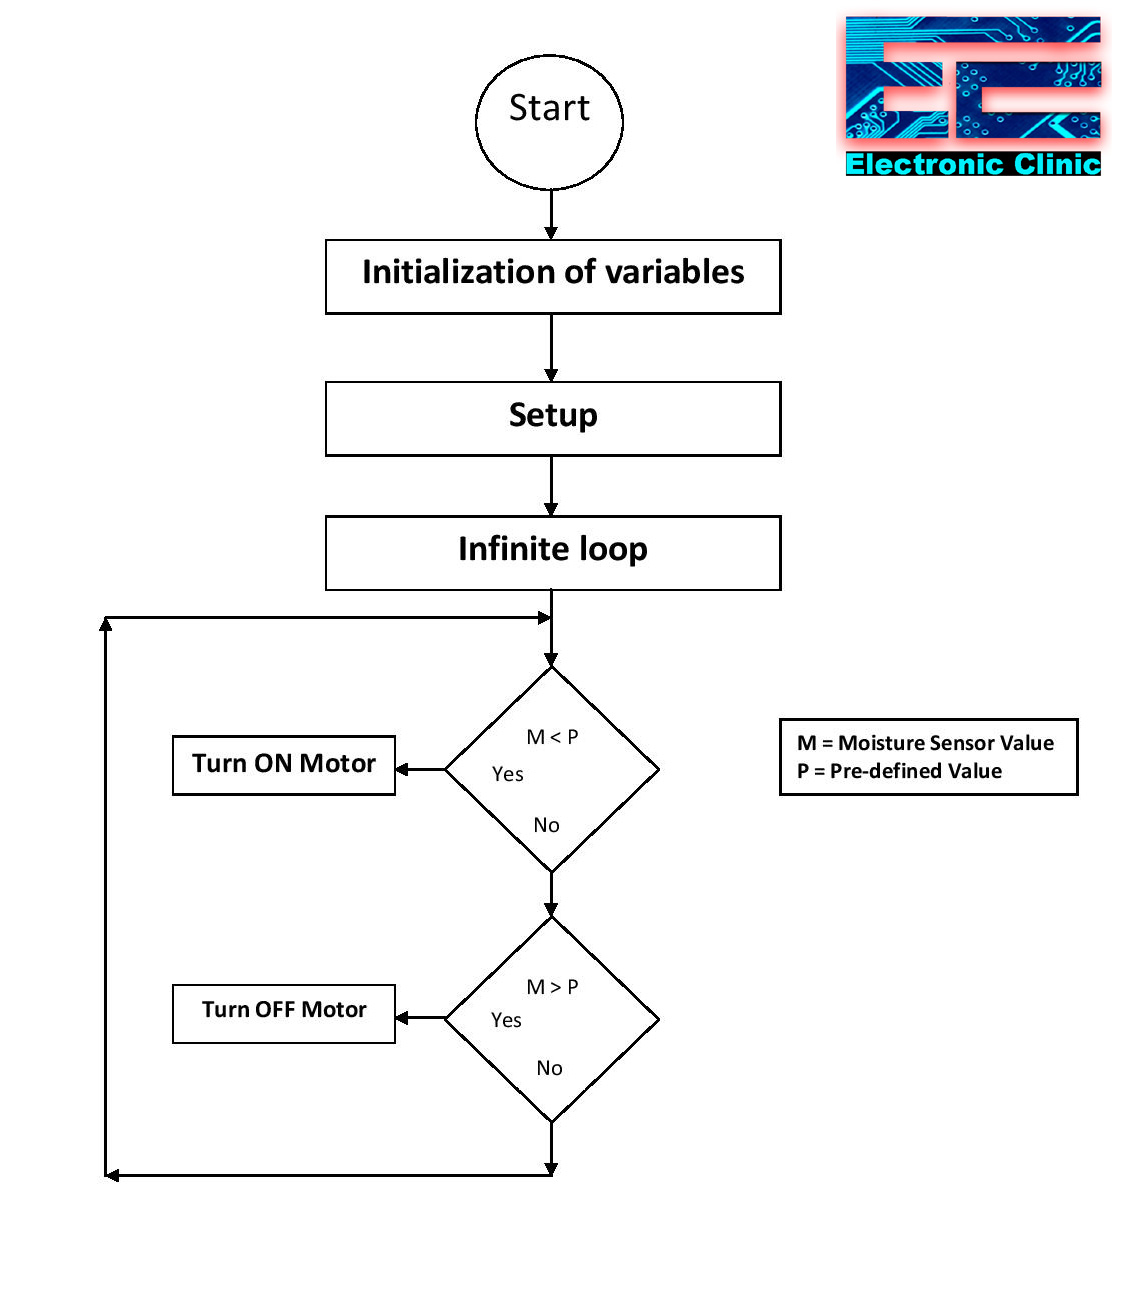
How to make Arduino soil moisture flowchart
This flow chart is for the Arduino based Soil Moisture monitoring system.
This is the same flowchart which is given above. This time I am going explain this. When the program starts, first of all, the variables are initialized, which can be the Arduino Uno Pins, or any other Controller board pins. This step also consists of the data variables. Next, step is the setup function which reminds the programmer to tell the controller about the pins, which pins are the input and which pins are the output, set the baud rate and other basics things. Then the infinite loop which is the void loop() function in the Arduino Programming.
There are two conditions which are used to compare the two variables M and P. M is the variable which stores the value coming from the Soil Moisture Sensor and P is the variable which stores the pre-defined value. The two variables are compared if M < P then turn ON the motor else the control transfers to the next condition. If M > P then turn OFF the motor else the control is transferred to the beginning and again starts comparing the variables. This process continues forever and stops only if the program is stopped I.e. when the Arduino Uno board is turned OFF.
Flow chart of the PLC and Arduino based Over Voltage System using SCADA:
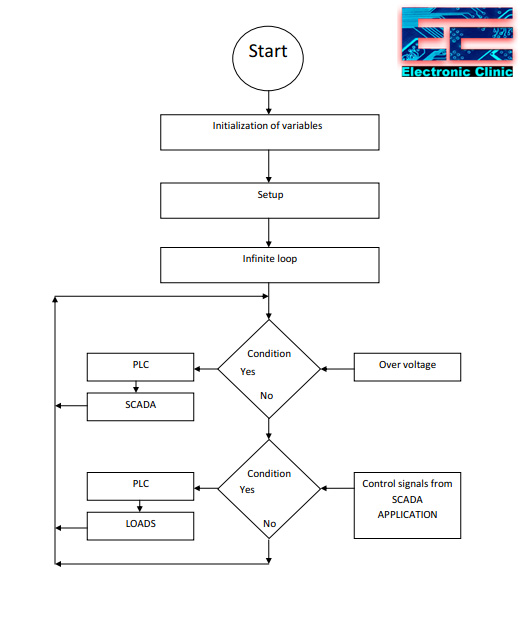
The boxes from start to the infinite loop are exactly the same as explained earlier. Let’s discuss the two conditions. The first condition checks if there is a High signal from the Overvoltage circuit then give a signal to the PLC input and the plc then sends data to the SCADA application. If there is no signal from the Overvoltage circuit then the control transfers to the second condition where the Arduino checks if there is any signal from the SCADA application, if there is a signal/command from the SCADA application then the Arduino sends a command to the SCADA application to turn on the specified load and if no signal/command then the control is transferred again to the beginning.
So from this flow chart, we can clearly see, that the purpose of this program is to monitor the Overvoltage and control the electrical loads using the computer SCADA application.
Flow chart of the Arduino based Solar Tracker:
![]()
The direction of rotation of the DC motor is controlled using the two LDR’s. Depending on the High and Low signals from the two LDR’s the H-bridge is controlled accordingly. For more information, you can read my article on the Arduino based Solar tracker.
Flow Chart of the Arduino Based Wheelchair:
I am sure, now you can explain this by yourself. If the Sensor1 value is greater than the threshold value which is a predefined value then execute some instructions, and if the sensor1 value is less than the threshold value then transfer the control to the next condition and check if the Sensor2 value is greater than the threshold value then execute some instructions and if no then transfer the control to the beginning and check again all the conditions. This process is repeated again and again.

Flow chart for the Visual Basic Image processing application:
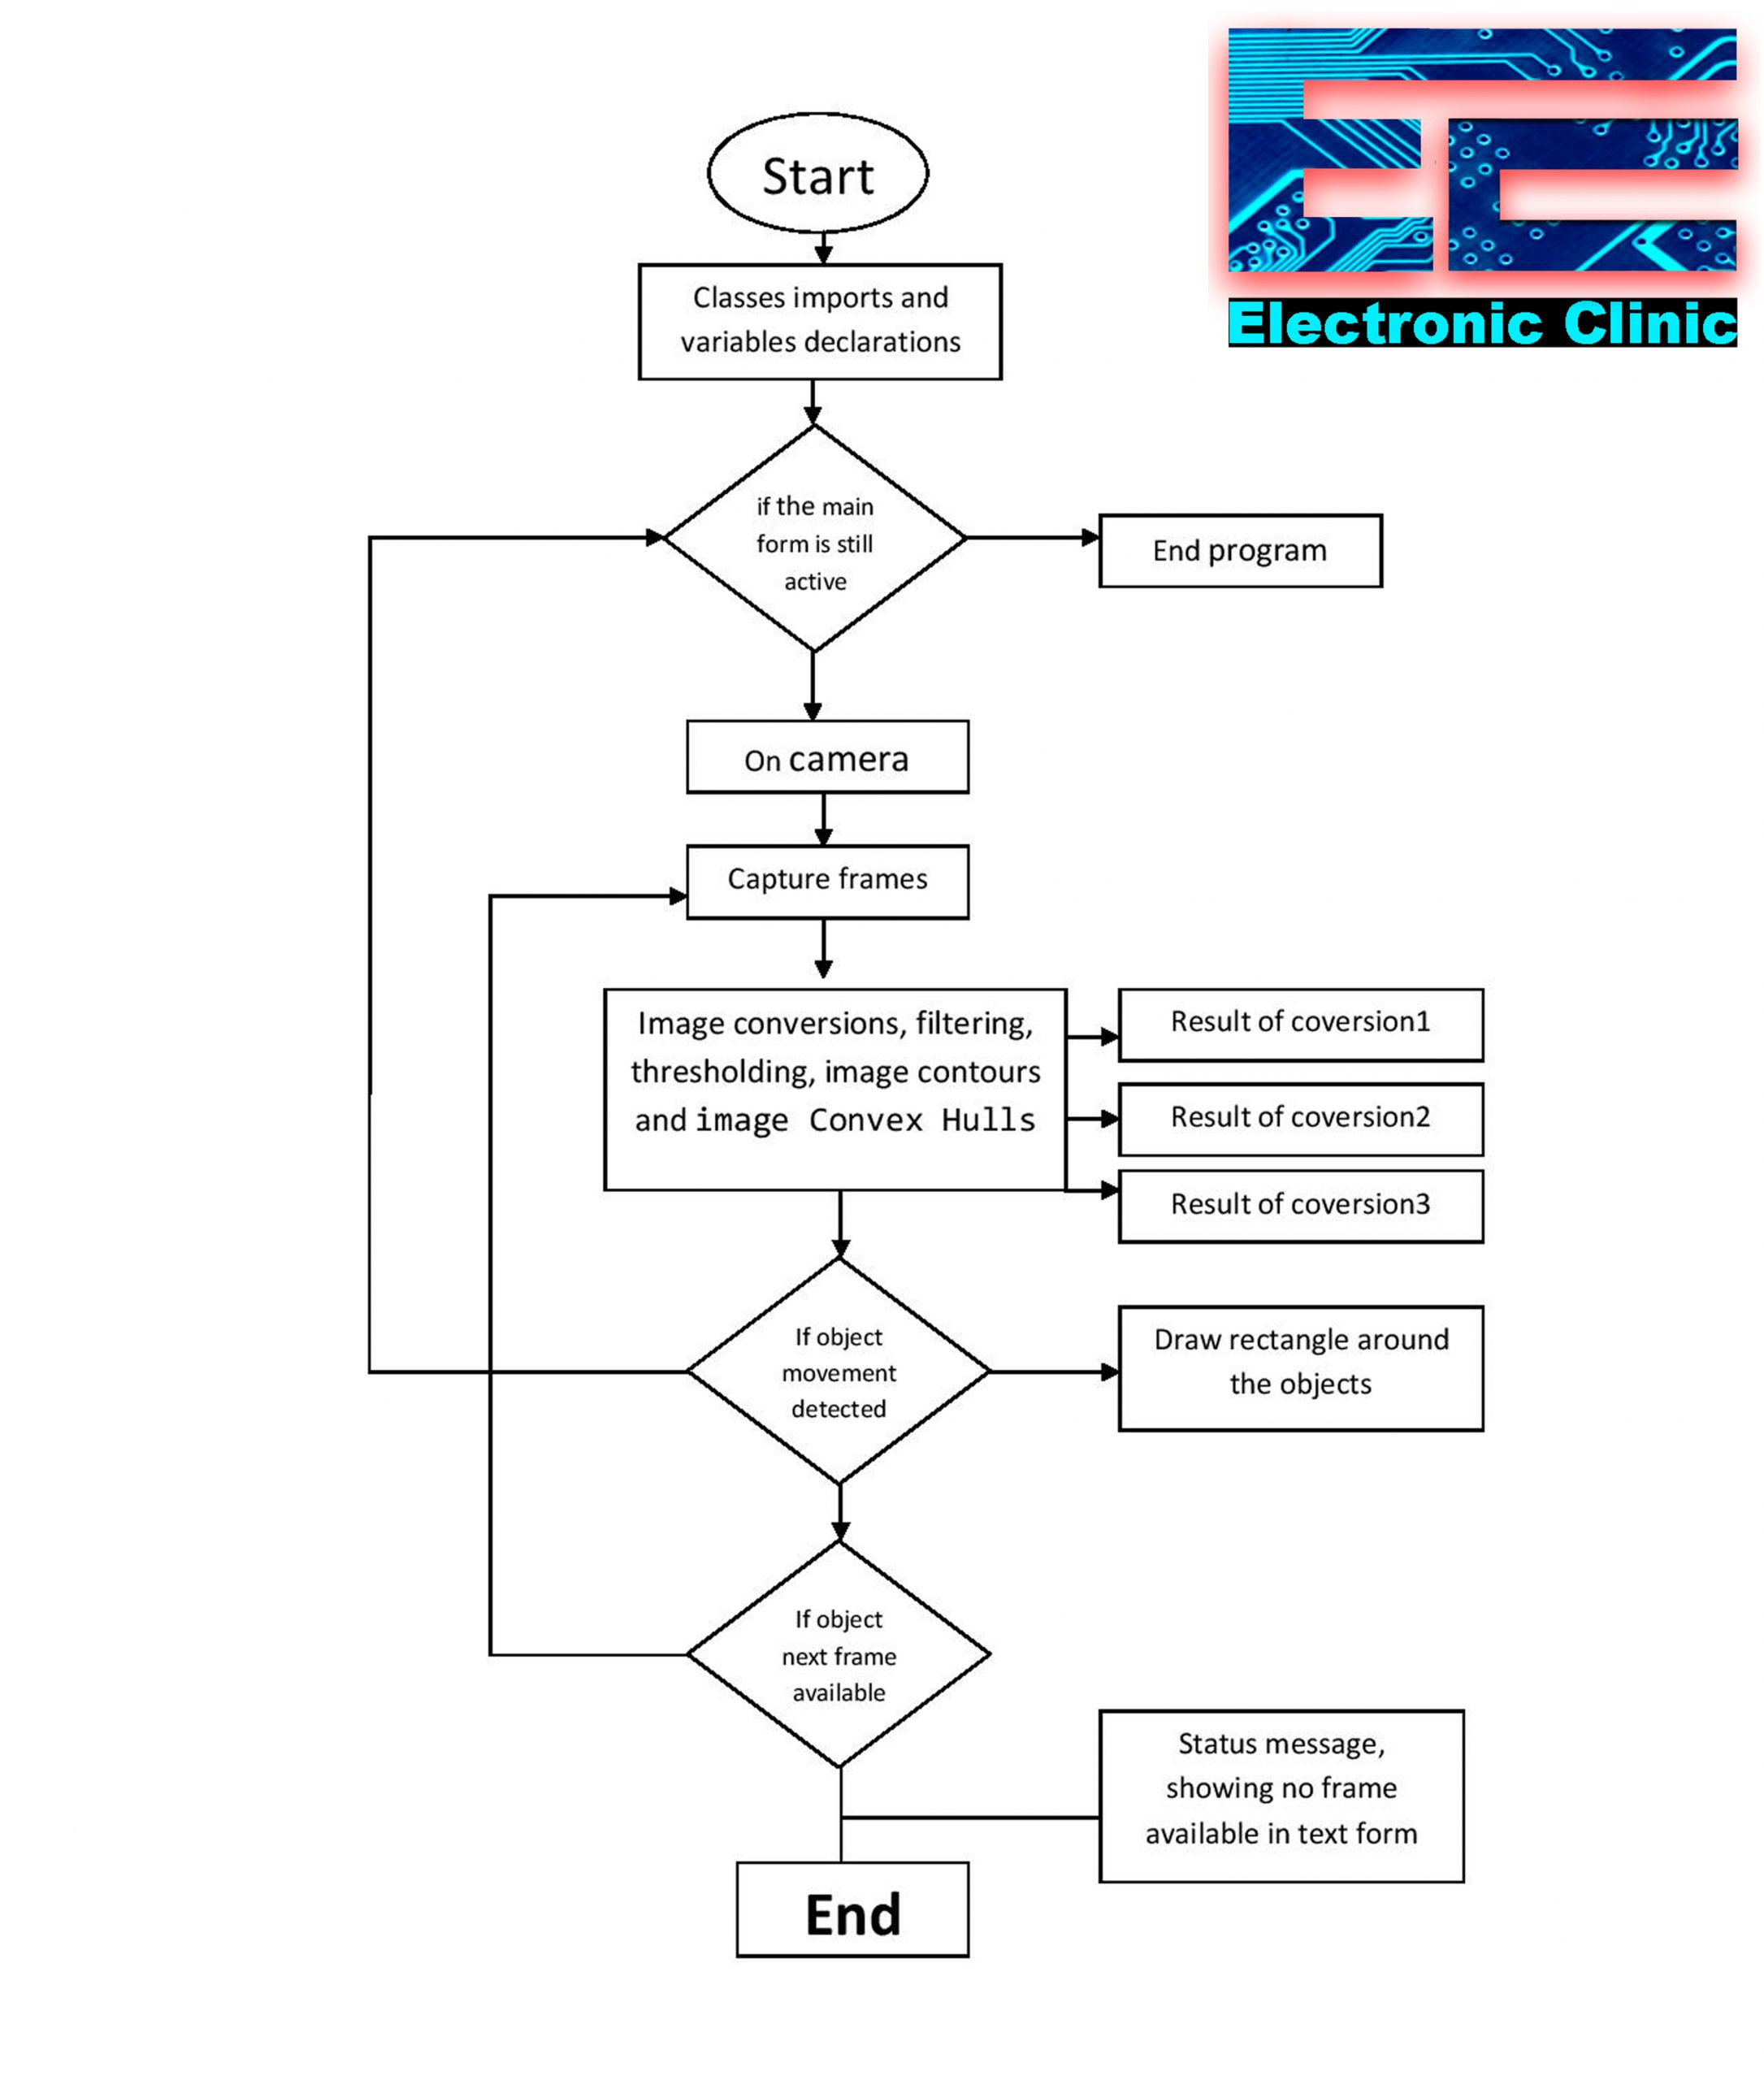
This is a bit complex version of the flow chart, where each box represents a long list of instructions. But as in the beginning, I said the purpose of the flow chart is only to develop the logic. But you can clearly see what’s going on this flow chart.
Flow chart of the Email Sending Visual Basic application:
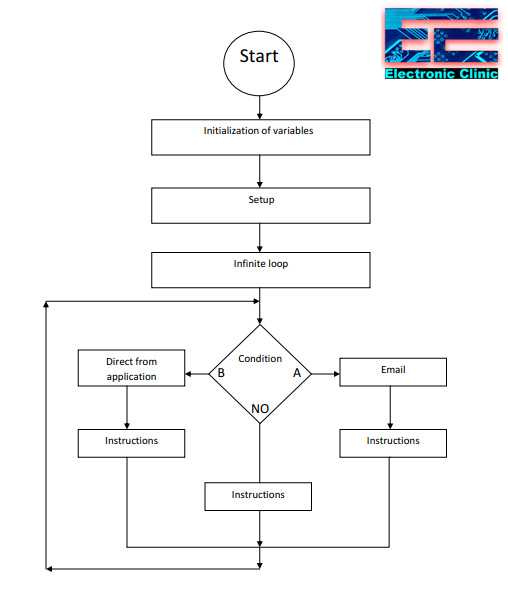
This time you can see we have multiple options. If A then send an email some instructions, if B then direct from the application section is activated, and if no then some other instructions are executed and finally, the control again transfers to the beginning.
Flowchart Software:
You can use Microsoft word for making flowcharts. All you need simply click on the Format Menu where you can find a lot of different types of boxes and arrows. Select the one you want and add it.

Google Flowchart:
You can also use a free online tool Lucidchart .
Flowchart samples:
You can download some flowchart samples which are given below. These flow charts are designed in Microsoft Word which can be easily modified as per your requirement.
Download Flowchart Samples: flowchart samples