IoT based Smart Energy Meter using ESP32 & Google Sheet or Google Spreadsheet
Last Updated on September 21, 2024 by Engr. Shahzada Fahad
Table of Contents
IoT based Smart Energy Meter:
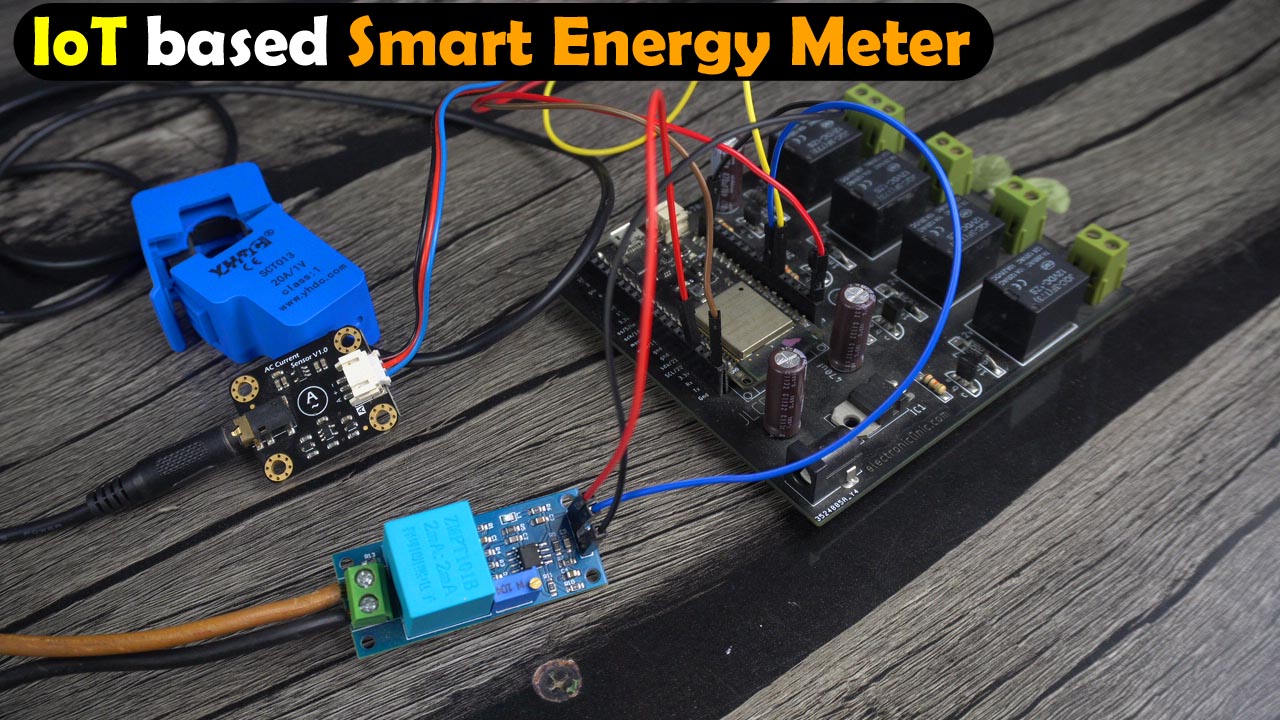
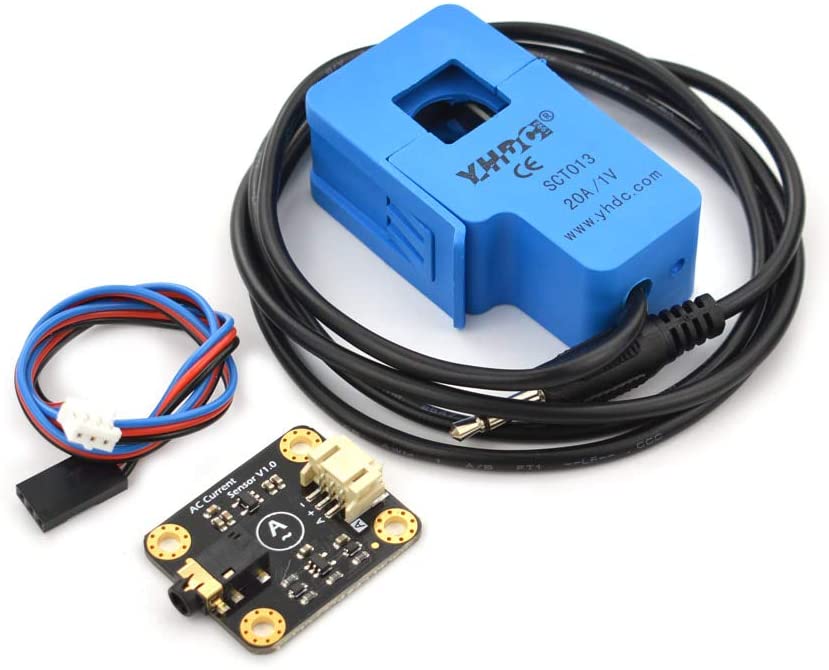
IoT based Smart Energy Meter using ESP32 & Google Sheet or Google Spreadsheet- In today’s article, you will learn how to make an IoT based Smart Energy Meter using ESP32 WiFi + Bluetooth module, the ZMPT101b AC Voltage Sensor, The DFrobot CT Clamp Current Sensor, And the Google Sheet or Google spreadsheet as the IoT platform for the real-time monitoring and data logging.
This is the prototype model of IoT based Smart energy meter.
And this is my Google spreadsheet for monitoring the Date, Time, Voltage, Current, Power, and Units.

But, before, I start the practical demonstration, there are certain things which I would like to talk about.
- You might be thinking, why Google sheet or Google spreadsheet as the IoT Platform? Why not Blynk IoT Platform? Well, Blynk is an amazing IoT platform and I have used it in so many projects and its good for the real-time data monitoring. But the Google spreadsheet is perfect for the real-time monitoring and Data logging. It’s absolutely free, you can monitor as many sensors as you want. You can use multiple Google sheets, and you don’t have to pay a single penny. I know, it doesn’t have those fancy widgets, but I really don’t care about the widgets. I want real-time monitoring and data logging; and I know Google spreadsheet is perfect for this job.
- As a beginner, you might also be thinking about why ESP32? Why not ESP8266. Well the answer is ESP8266 has only 1 analog pin whereas on the other hand ESP32 has got multiple Analog pins and it also has the advantage of having a Bluetooth module. I am not saying that you can’t use the Nodemcu ESP8266 for monitoring multiple analog sensors. You can use the ADS1015 to increase the analog pins on the ESP8266 for connecting multiple analog sensors.
- Your Sensors (“Voltage sensor and Current Sensor”) should be calibrated otherwise your project won’t be of any use. In my previous Arduino Home Energy Monitor based project, I explained in detail how to calibrate the ZMPT101b AC voltage Sensor, and
how to calibrate the CT Clamp Current Sensor. So, you can apply the same calibration techniques over here.
I think, I have shared enough useful information with you guys. So, now, let’s go ahead and start the practical demonstration.
Read my article on “LoRa Energy Meter“.
IoT based Smart Energy Meter, Practical Demonstration:
My laptop is connected to the WiFi. Since this is an IoT based project, it really doesn’t matter if you connect the laptop and ESP32 to the same WiFi network or different WiFi networks. Anyway, in the Google spreadsheet I will be monitoring the Date, Time, Voltage, Current, Power, and Units.
I am going to supply AC voltage to the ZMPT101b AC voltage sensor.
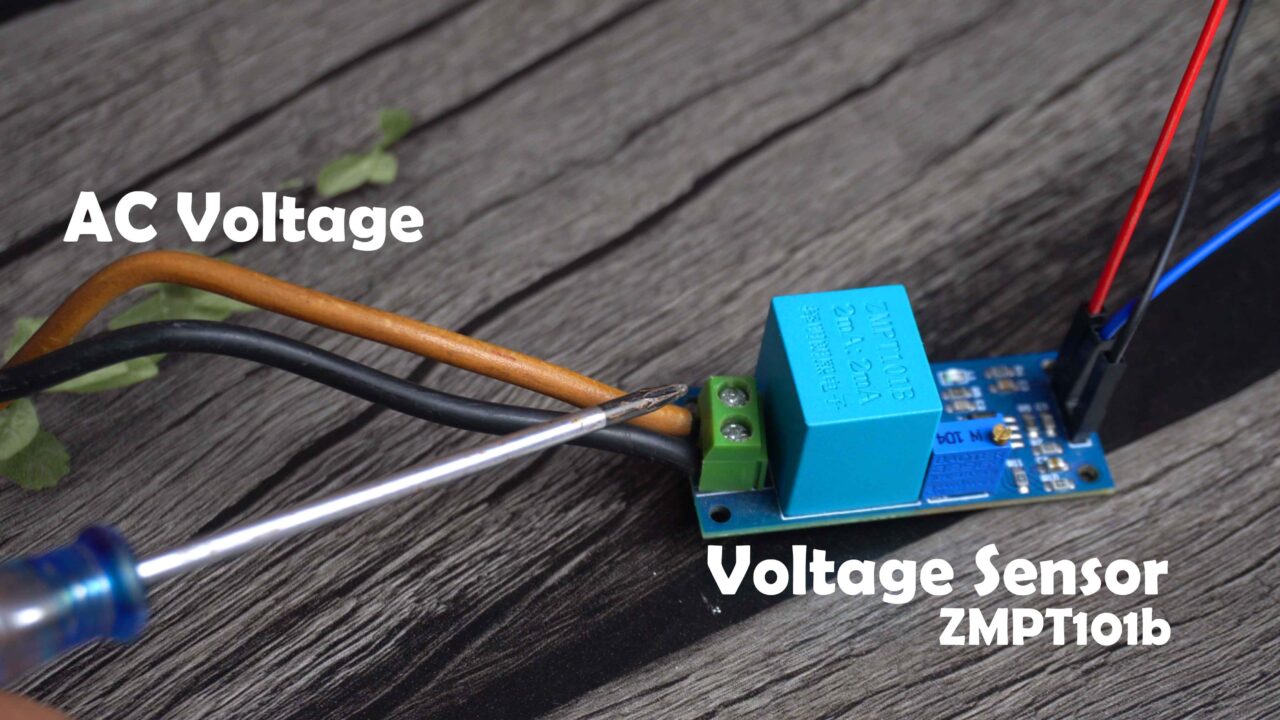
Be very careful, never touch these contacts when the AC supply is connected. Next, I attached the CT Clamp Current Sensor.
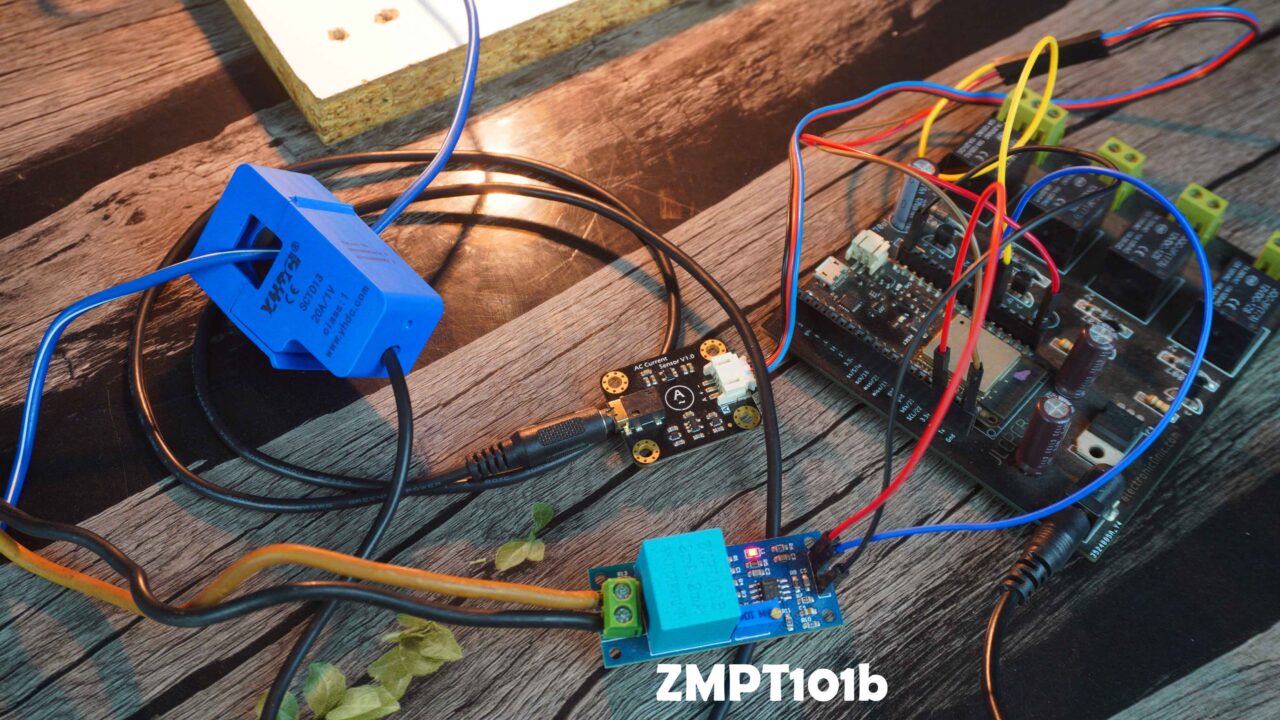
Everything looks good but first I am going to measure the actual voltage and current.

The actual voltage is 168 volts and the actual load current fluctuates between 0.35 and 0.36 ampere.
Now let’s power up the ESP32 WiFi + Bluetooth Module. As you can see I am able to receive the desired values.

You can see the measured voltage and current values are pretty close to the actual voltage and current values. If on your side the current value is different then you can change the correctionfactor value in the programming. Anyway, once the data is received in the Google Spreadsheet then it’s not going anywhere unless you delete it yourself.
Anyway, you can also monitor the same values on your cell phone.
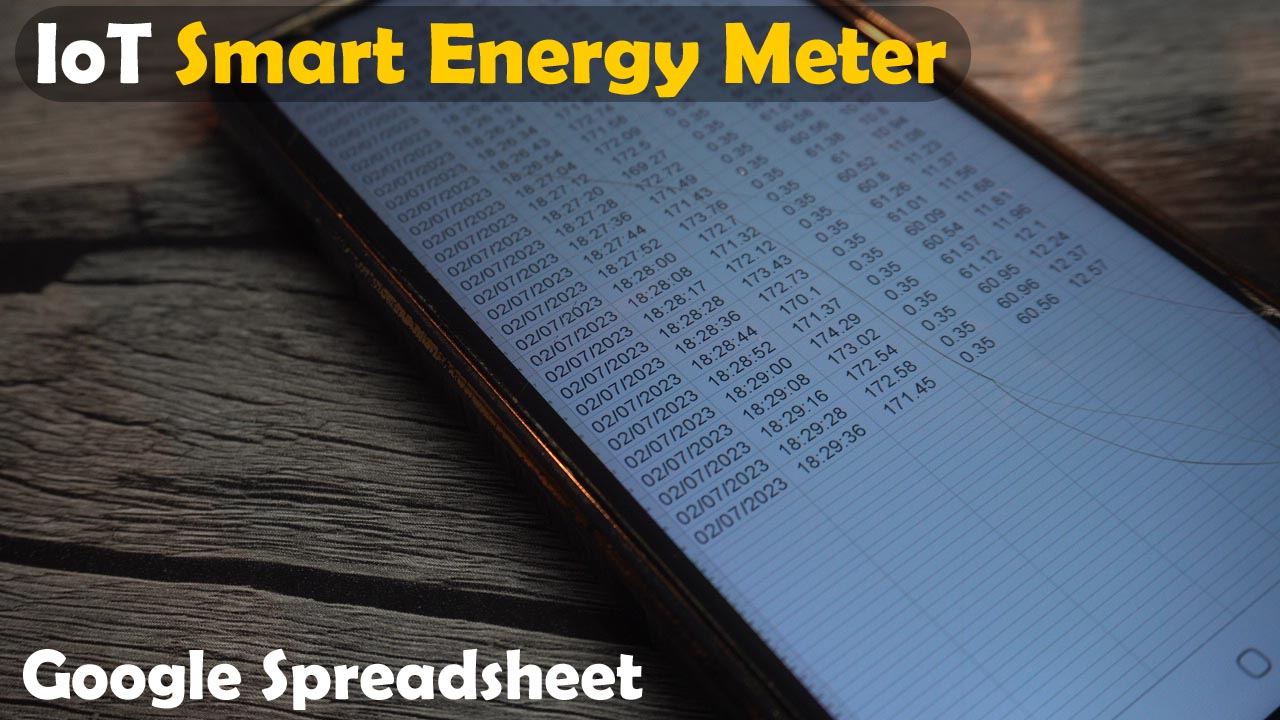
All you need is to login into your account. You can check the voltage, current, power, and units at any given time.
Amazon Links:
ESP32 WiFi + Bluetooth Module(Recommended)
*Disclosure: These are affiliate links. As an Amazon Associate I earn from qualifying purchases.
Gravity: Analog AC Current Sensor (20A)
When you want to measure the AC current, are you still having trouble cutting the wires, wiring, or soldering. Gravity: Analog AC Current Sensor comes to the rescue, eliminating the need to cut wires or reconnect circuits. Simply clamp the AC transformer probe on the AC line, and then plug the 3.5mm headphone jack into the signal conversion module to read the current AC current value. The analog output is designed to be compatible with 3V3/5V micro-controller. It can be conveniently used for AC current measurement to monitor AC motors, lighting equipment, air compressors, etc.
Pin Description:
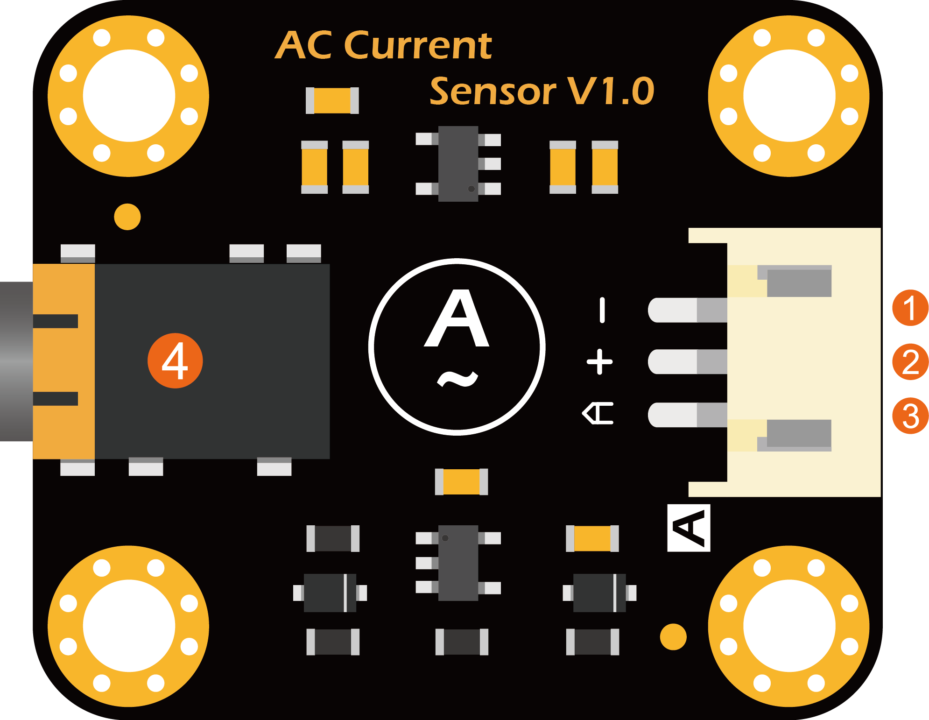
| LABEL | NAME | Function Description |
| 1 | – | GND |
| 2 | + | Power Input (3.3V-5.5V) |
| 3 | A | Signal Output (0.2-2.8VDC) |
| 4 | Φ3.5mm 3P plug | AC Transformer Input Signal |
FEATURES
- Non-contact measurement, high safety
- Multiple ranges for various measurement scenarios
- Compatible with 3V3/5V micro-controller
APPLICATIONS
- AC motor automatic monitoring
- Lighting and electrical equipment measurement
SPECIFICATION
AC Current Signal Conversion Module
- Input Voltage (VCC): 3.3V-5.5V
- Interface: Gravity Analog (PH2.0-3P,analog voltage output 0.2-2.8V DC)
- AC Voltage Input Range: 0-1V (AC RMS)
- Relative Error: ±4%
- Dimension: 32×27 mm /1.26×1.06 in
- Weight: 5g
Open Type AC Transformer Probe
- AC Current Range: 0-20A
- Signal Output (standard Φ3.5mm 3P plug): 0-1V AC voltage, linear corresponding range 0-20A
- Accuracy: ±1%
- Non-linearity: ≤±0.2%
- Frequency Range: 50Hz~1kHz
- Cable Length: 1m
- Working Temperature: -25 ℃~+70 ℃
- Opening Size: 13×13 mm / 0.51×0.51 in
- Weight: 50g
ZMPT101B 230 volts AC Mains Voltage Sensor:
This module is based on a high precision ZMPT101B voltage Transformer. This module makes it easy to monitor AC mains voltage up to 250 volts. This module comes with Multi-turn trim pot which can be used for adjusting the Analog output.Using ZMPT101B AC Voltage Sensor you can easily measure main voltage using Arduino or even Raspberry Pi (external ADC required).
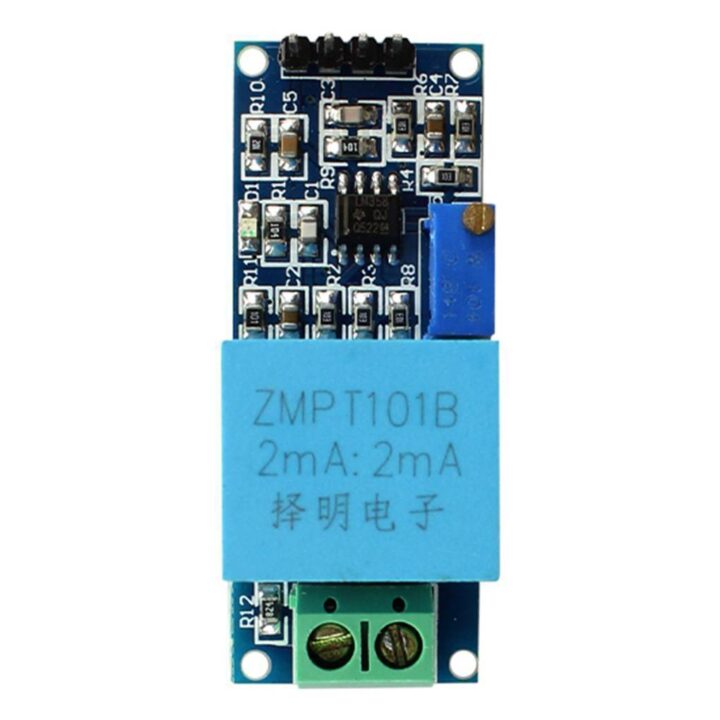
Features of ZMPT101B AC voltage sensor Module
- Voltage upto 250 volts can be measured
- Light weight with on-board micro-precision voltage transformer
- High precision on-board op-amp circuit
- Operating temperature: 40ºC ~ + 70ºC
- Supply voltage 5 volts to 30 volts
Advantages of ZMPT101B AC voltage sensor
- Analog output corresponding quantity can be adjusted.
- Pcb board size: 49.5 (mm) x19.4 (mm)
- Good consistency, for voltage and power measurement
- Very efficient and accuracy
Now, let’s go ahead and take a look at the connections.
IoT based Smart Energy Meter, Circuit Diagram:

Connect the VCC and GND pins of the ZMPT AC voltage sensor to the ESP32 3.3V and GND. Connect the Out pin of the ZMPT voltage sensor to the ESP32 IO34.
Connect the VCC and GND wires of the AC Current Sensor to the ESP32 3.3V and GND. Connect the output signal wire A to the ESP32 IO33.
So, that’s all about the connections.
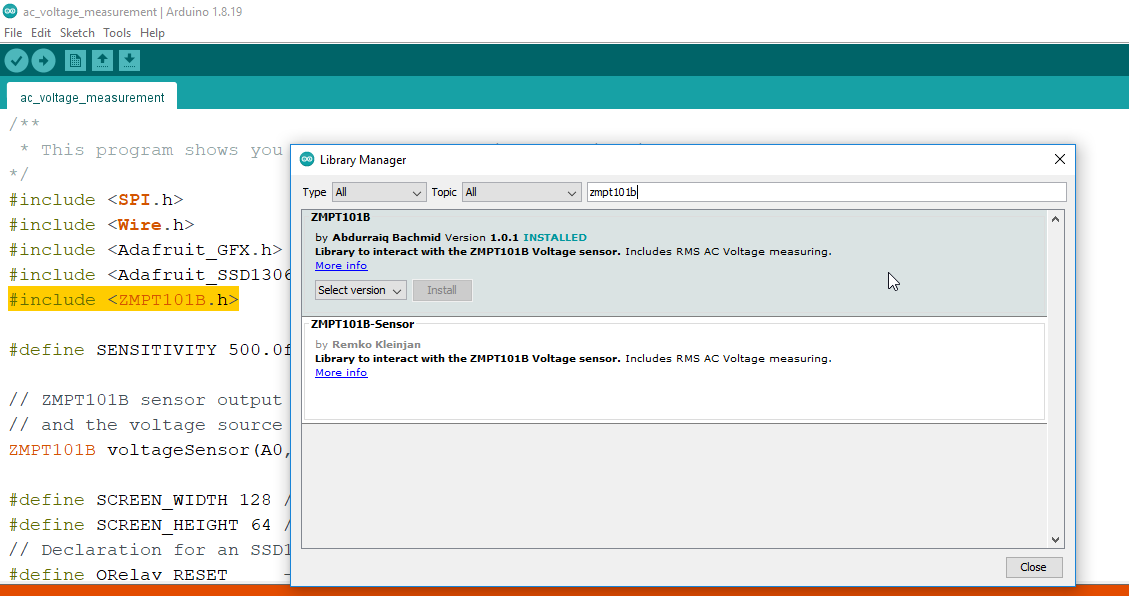
Required Library(Arduino IDE):
You will also need to download the ZMPT101B library. Go to the Sketch menu > then to Include Library > and click on the Manage Libraries. Search for the ZMPT101B library and install it.
Now, let’s go ahead and start with the Google Spreadsheet setup.
ESP32 & Google Spreadsheet Setup:
While you are logged in into your registered Gmail id, click on Google apps and then click on sheets.

Click on Start a new spreadsheet.

Enter your project name.
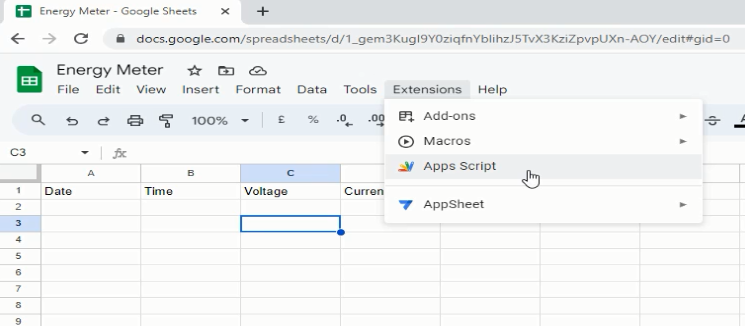
Set the column names.

Go to the Extensions menu and click on the Apps Script.
Then rename the untitled project in App script
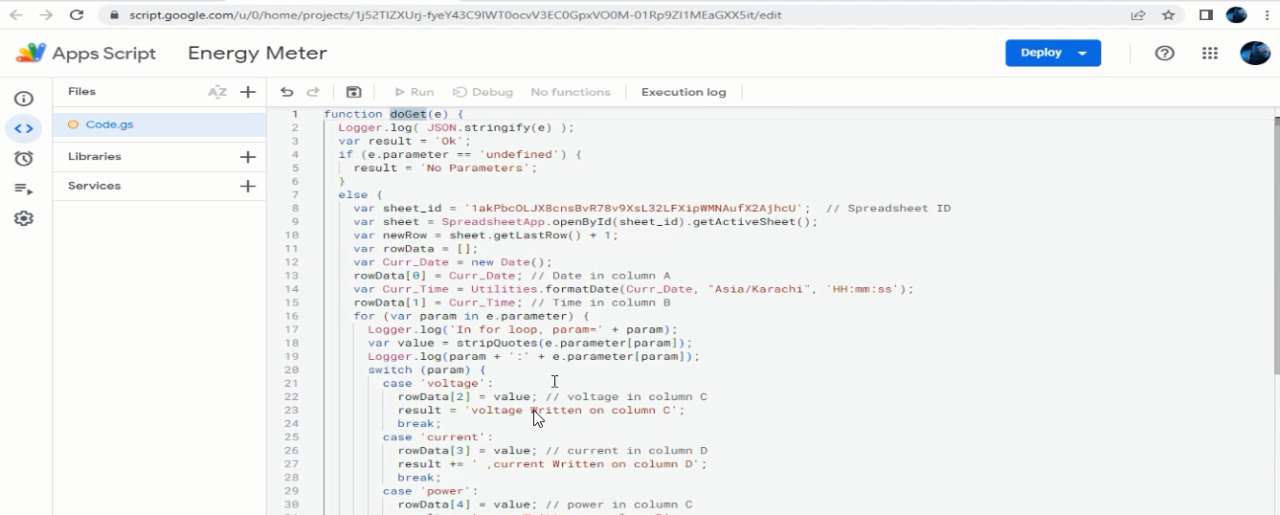
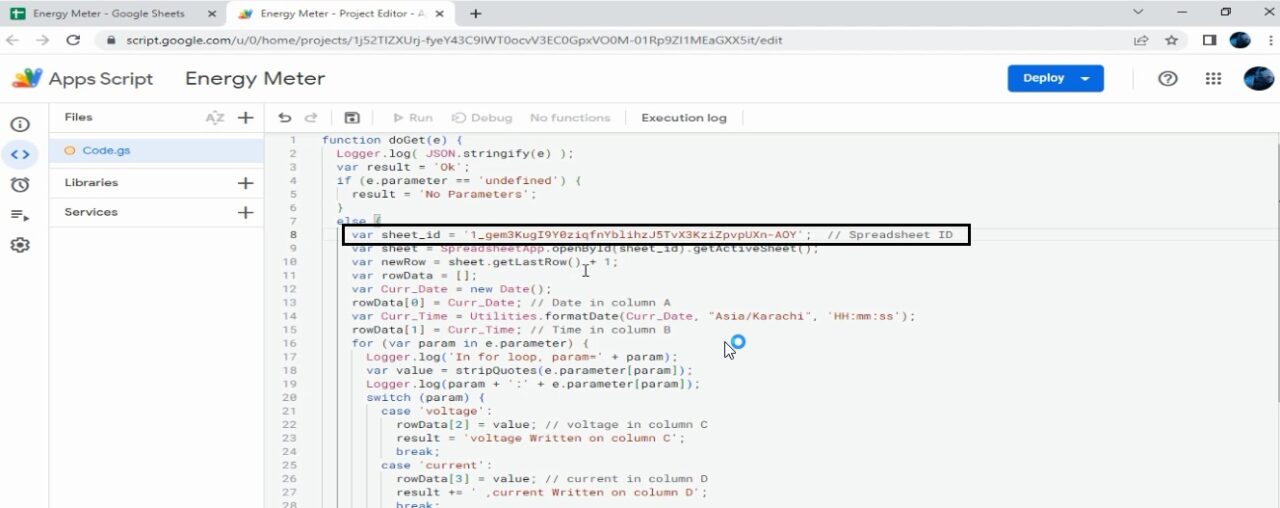
Then copy the following Google script code and paste it
|
1 2 3 4 5 6 7 8 9 10 11 12 13 14 15 16 17 18 19 20 21 22 23 24 25 26 27 28 29 30 31 32 33 34 35 36 37 38 39 40 41 42 43 44 45 46 47 48 49 50 |
functiondoGet(e) { Logger.log(JSON.stringify(e) ); var result = 'Ok'; if (e.parameter == 'undefined') { result = 'No Parameters'; } else { varsheet_id = '1akPbcOLJX8cnsBvR78v9XsL32LFXipWMNAufX2AjhcU'; // Spreadsheet ID var sheet = SpreadsheetApp.openById(sheet_id).getActiveSheet(); varnewRow = sheet.getLastRow() + 1; varrowData = []; varCurr_Date = new Date(); rowData[0] = Curr_Date; // Date in column A varCurr_Time = Utilities.formatDate(Curr_Date, "Asia/Karachi", 'HH:mm:ss'); rowData[1] = Curr_Time; // Time in column B for (varparam in e.parameter) { Logger.log('In for loop, param=' + param); var value = stripQuotes(e.parameter[param]); Logger.log(param + ':' + e.parameter[param]); switch (param) { case 'voltage': rowData[2] = value; // voltage in column C result = 'voltage Written on column C'; break; case 'current': rowData[3] = value; // current in column D result += ' ,current Written on column D'; break; case 'power': rowData[4] = value; // power in column C result += 'power Written on column D'; break; case 'units': rowData[5] = value; // units in column C result += 'units Written on column E'; break; default: result = "unsupported parameter"; } } Logger.log(JSON.stringify(rowData)); varnewRange = sheet.getRange(newRow, 1, 1, rowData.length); newRange.setValues([rowData]); } returnContentService.createTextOutput(result); } functionstripQuotes( value ) { returnvalue.replace(/^["']|['"]$/g, ""); } |
Go to your Google Spreadsheet and copy this part of the URL.

And paste it in the script.
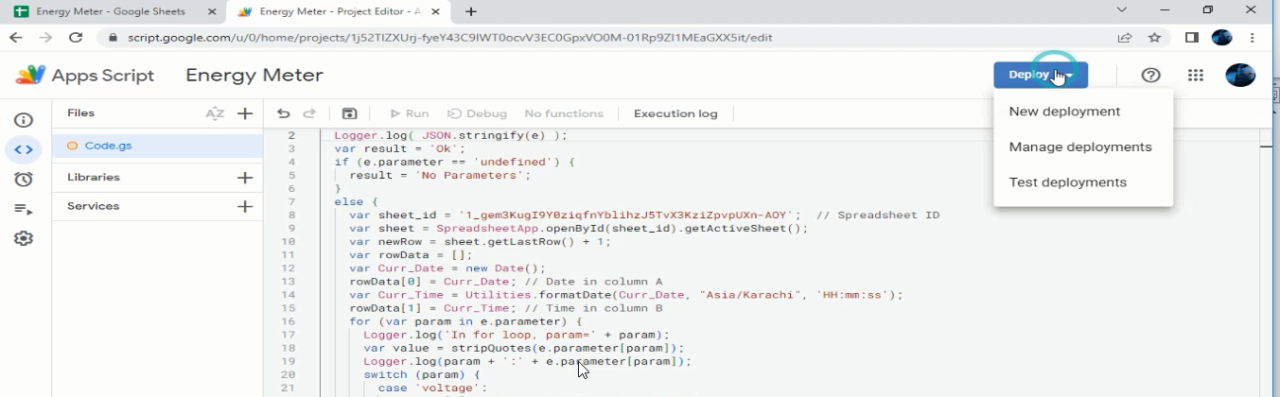
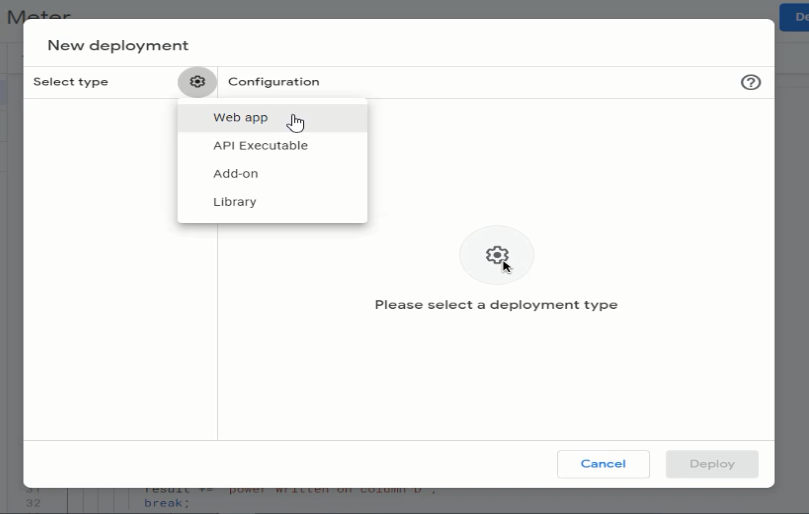
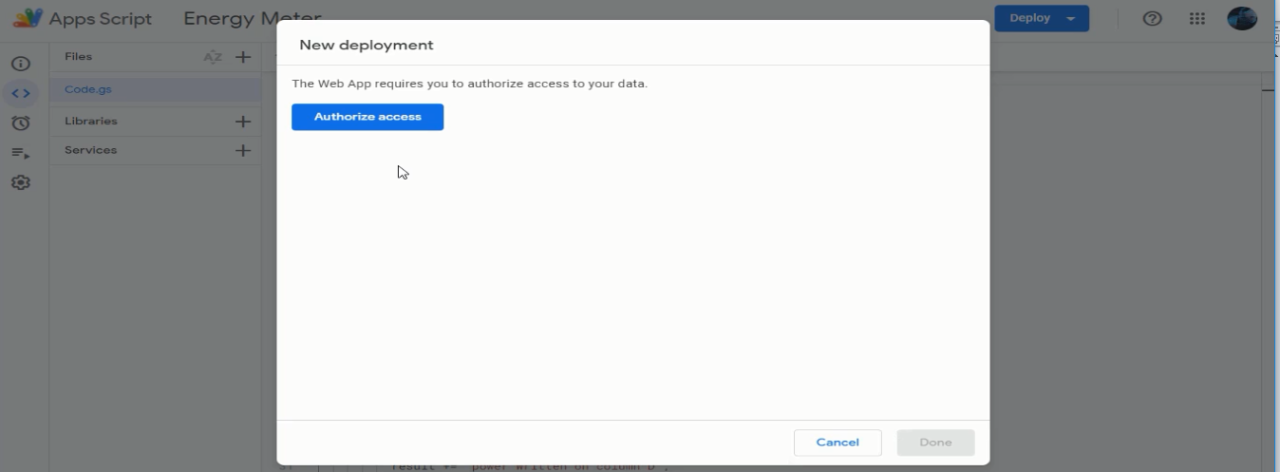
Click on the Deploy button and select New deployment.
Click on Enable deployment types and select Web app.
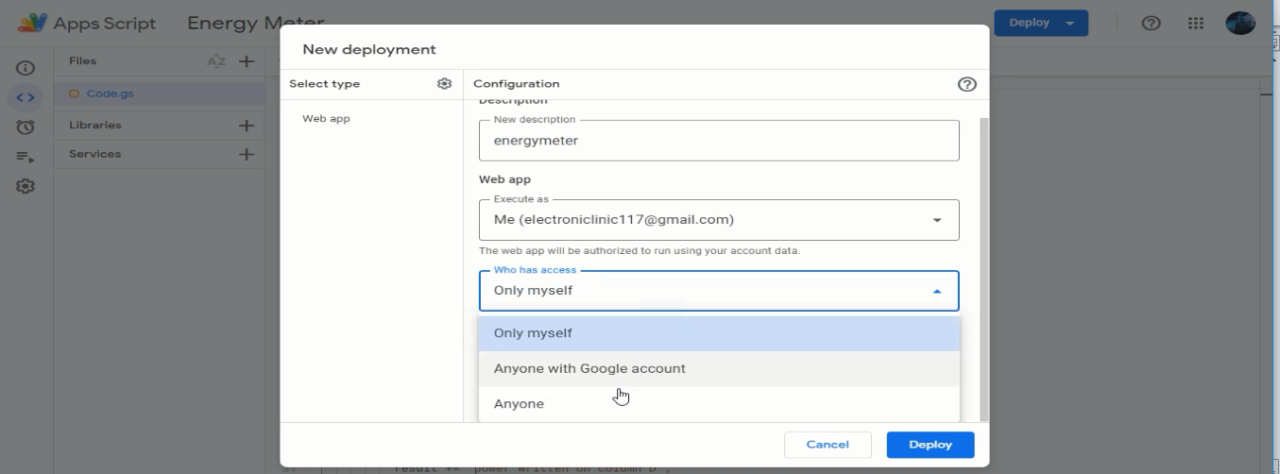
Write the description and Under who has access, select Anyone and then click on the Deploy button.
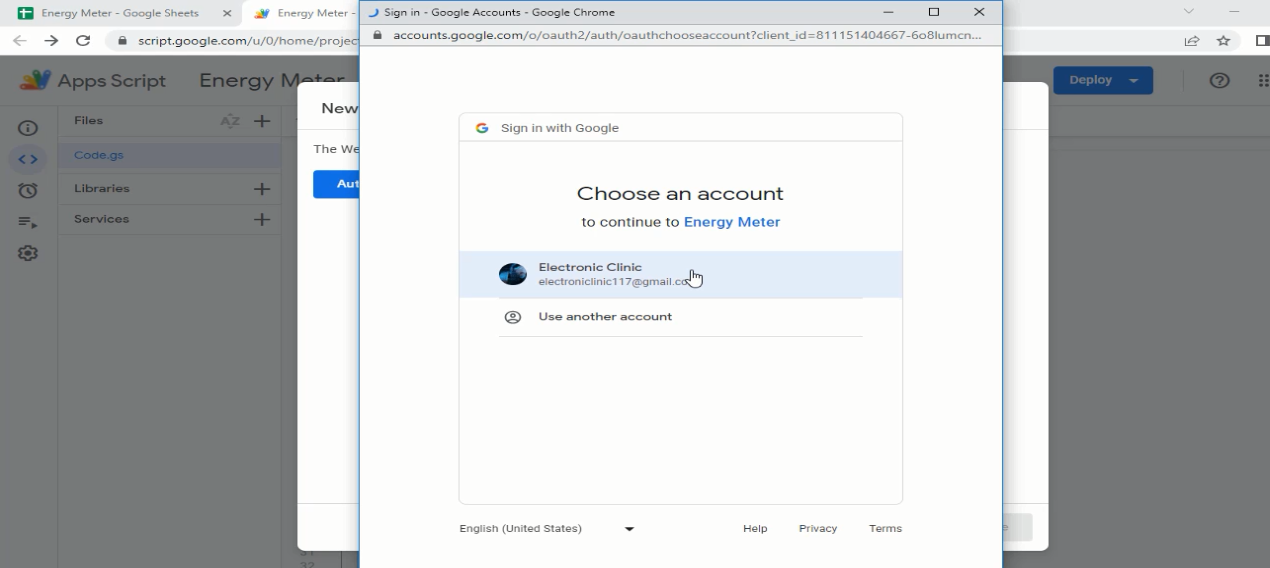
Clik on Authorize access.
Select your Gmail account.
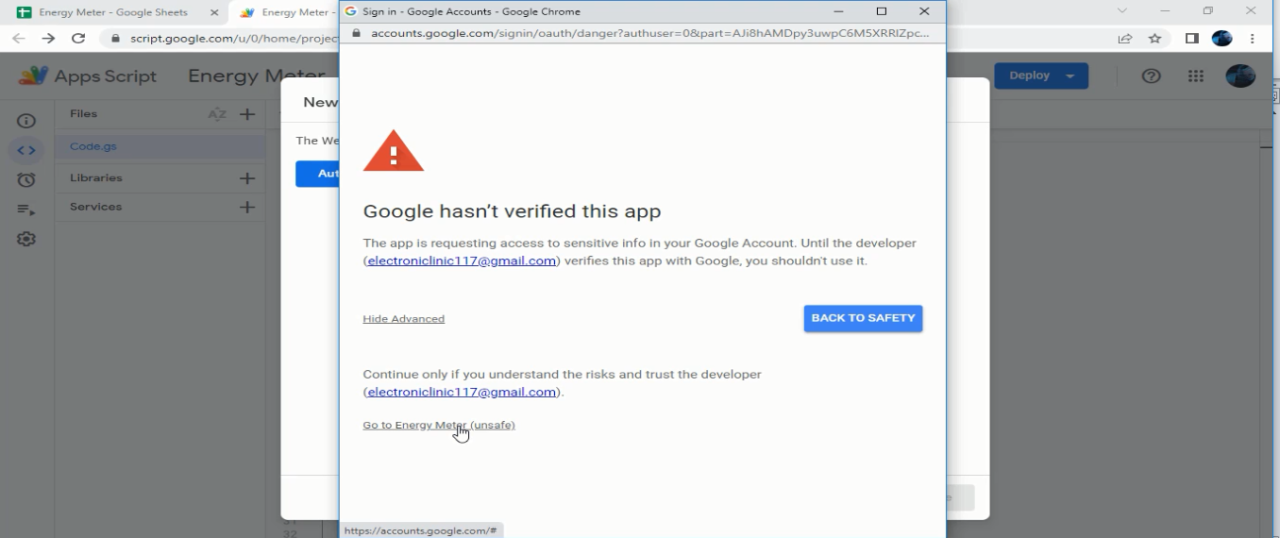
Click on Advanced and select the project Go to Energy Meter (Unsafe).
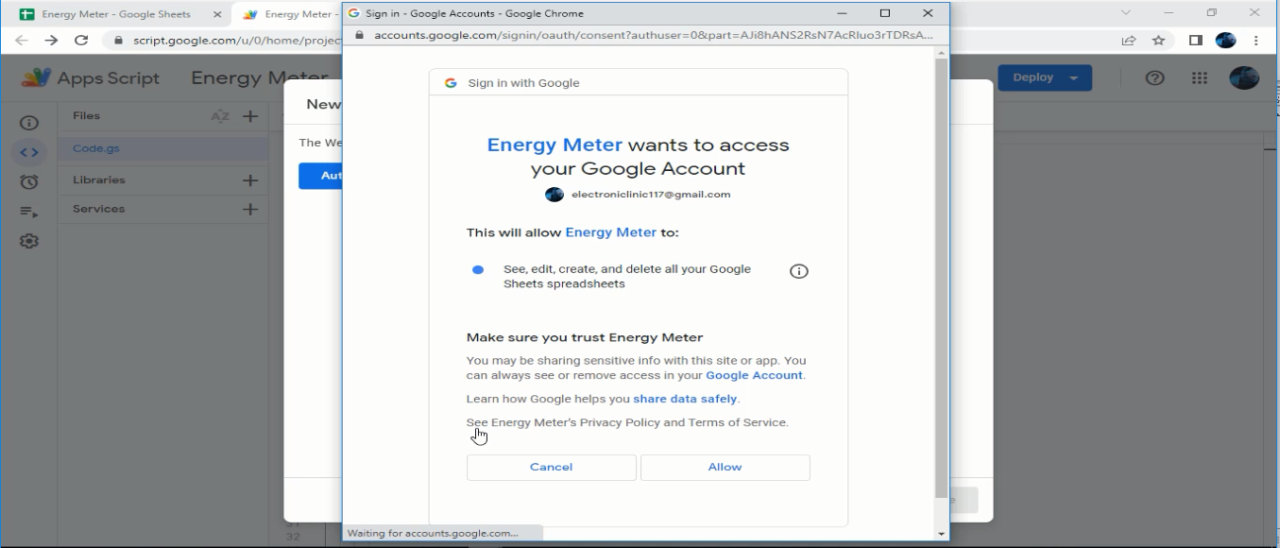
Click the Allow button.
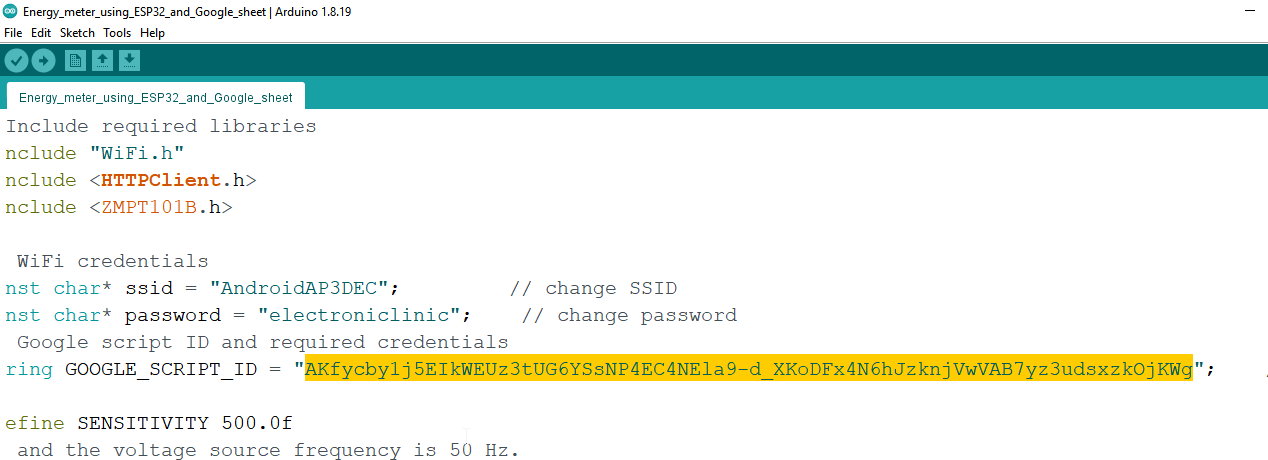
Copy the Deployment ID.
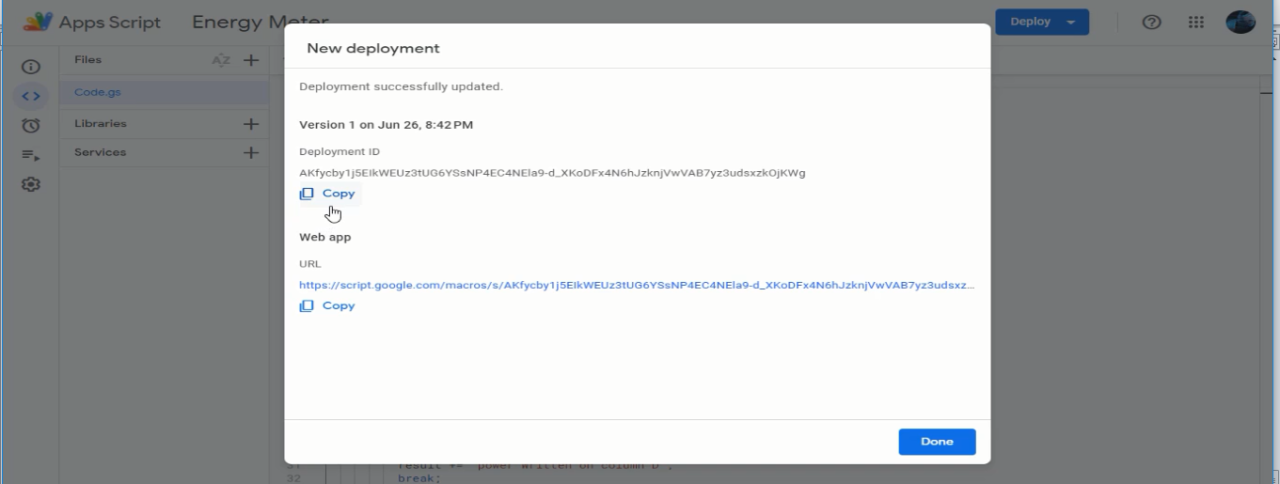
Copy the following IoT based Smart Energy Meter programming and paste the Deployment ID
next to the GOOGLE_SCRIPT_ID. And that’s it.
IoT based Smart Energy Meter, ESP32 Programming:
|
1 2 3 4 5 6 7 8 9 10 11 12 13 14 15 16 17 18 19 20 21 22 23 24 25 26 27 28 29 30 31 32 33 34 35 36 37 38 39 40 41 42 43 44 45 46 47 48 49 50 51 52 53 54 55 56 57 58 59 60 61 62 63 64 65 66 67 68 69 70 71 72 73 74 75 76 77 78 79 80 81 82 83 84 85 86 87 88 89 90 91 92 93 94 95 96 97 98 99 100 101 102 103 104 105 106 |
//Include required libraries #include "WiFi.h" #include <HTTPClient.h> #include <ZMPT101B.h> // WiFi credentials const char* ssid = "AndroidAP3DEC"; // change SSID const char* password = "electroniclinic"; // change password // Google script ID and required credentials String GOOGLE_SCRIPT_ID = "AKfycby1j5EIkWEUz3tUG6YSsNP4EC4NEla9-d_XKoDFx4N6hJzknjVwVAB7yz3udsxzkOjKWg"; // change Gscript ID #define SENSITIVITY 500.0f // and the voltage source frequency is 50 Hz. int vsensor=34; const int ACPin = 33; ZMPT101B voltageSensor(vsensor, 50.0); float correctionfactor=20; float Current_Value = 0; #define ACTectionRange 20; //set Non-invasive AC Current Sensor tection range (5A,10A,20A) #define VREF 3.3 char units[5]; unsigned long last_time =0; unsigned long current_time =0; float Wh =0 ; void setup() { Serial.begin(115200); pinMode(ACPin,INPUT); voltageSensor.setSensitivity(SENSITIVITY); // connect to WiFi Serial.println(); Serial.print("Connecting to wifi: "); Serial.println(ssid); Serial.flush(); WiFi.begin(ssid, password); while (WiFi.status() != WL_CONNECTED) { delay(500); Serial.print("."); } } void loop() { char units; float ACcurrent=0; float current_value = readACCurrentValue(); ACcurrent=current_value; delay(1000); //Serial.print(ACcurrent); //Serial.println("Current: "); float acvoltage = voltageSensor.getRmsVoltage(); Serial.println(acvoltage); float P = acvoltage * ACcurrent; last_time = current_time; current_time = millis(); Wh = Wh+ P *(( current_time -last_time) /3600000.0) ; // dtostrf(Wh, 4, 2, units); String urlFinal = "https://script.google.com/macros/s/"+GOOGLE_SCRIPT_ID+"/exec?"+"voltage="+ String(acvoltage)+ "¤t=" + String(ACcurrent)+ "&power=" + String(P)+ "&units=" + String(Wh); // Serial.print("POST data to spreadsheet:"); //Serial.println(urlFinal); HTTPClient http; http.begin(urlFinal.c_str()); http.setFollowRedirects(HTTPC_STRICT_FOLLOW_REDIRECTS); int httpCode = http.GET(); //Serial.print("HTTP Status Code: "); //Serial.println(httpCode); //--------------------------------------------------------------------- //getting response from google sheet String payload; if (httpCode > 0) { payload = http.getString(); Serial.println("Payload: "+payload); } //--------------------------------------------------------------------- http.end(); delay(1000); } float readACCurrentValue() { float ACCurrentValue = 0; float peakVoltage = 0; float voltageVirtualValue = 0; //Vrms for (int i = 0; i < 5; i++) { peakVoltage += analogRead(ACPin); //read peak voltage Serial.println(ACPin); peakVoltage = peakVoltage + correctionfactor; delay(1); } peakVoltage = peakVoltage / 5; voltageVirtualValue = peakVoltage * 0.707; //change the peak voltage to the Virtual Value of voltage /*The circuit is amplified by 2 times, so it is divided by 2.*/ voltageVirtualValue = (voltageVirtualValue / 4095 * VREF ) / 2; ACCurrentValue = voltageVirtualValue * ACTectionRange; return ACCurrentValue; } |
Finally, you can select your ESP32 board and the communication port, and click on the upload button. And don’t forget to change your SSID and password.
Note: If you can’t see your ESP32 board in the Arduino IDE boards list; it means your ESP32 board is not installed. For this you can read my getting started article on the ESP32.
Don’t forget to like, share, and Subscribe to my YouTube channel “Electronic Clinic”.
Watch Video Tutorial:

Discover more from Electronic Clinic
Subscribe to get the latest posts sent to your email.


Hi, I am trying to do make this project but there are so many errors in the script. Can you help me out regarding issue. I’ll be very thankful to you for this.