RRDtool based Raspberry Pi Smart Meter
Last Updated on September 12, 2021 by Engr. Shahzada Fahad
Table of Contents
RRDtool based Raspberry Pi Smart Meter, Overview:
RRDtool based Raspberry Pi Smart Meter– In this tutorial you will learn how to make a new type of electricity Meter called Smart Meter using Raspberry Pi and RRDtool. This tutorial mainly focuses on how to convert an existing electricity meter into a smart meter by reading the data out of the meter using Raspberry Pi with the help of RRDtool. This technique cannot be used with all types of electricity or energy meters, I will explain this in a minute. Anyhow, the results that you read can be used in many ways. You can monitor your electricity consumption at any time. With this technology, you can precisely track and display the data graphically. If you have a photovoltaic system, you can also record exactly how much current flows in which direction. We use a round robin database (RRD) to process the measurement data. This database is optimized for the acquisition of time-related data. The highlight is there that the database does not keep growing over time. Much more data from past time periods are continuously summarized (compressed). Depending on the configuration, for example, an exact evaluation of the last 24 hours possible, as well as summary evaluations of the Last Week, last month, and last year. Older details will be overwritten cyclically with a ring buffer.
Electric meter basics:
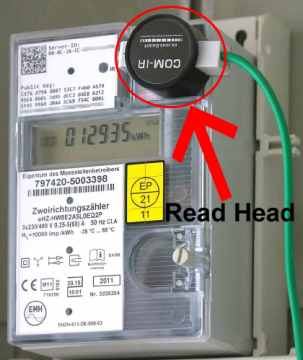
Take a look at your electricity meter. Is it still using an old device the classic rotating counter disc? Then, unfortunately, you are unlucky – You might have seen such electricity meters as a counter to display the number of units being consumed. Now to read these counters automatically you will need to modify the system, for example, a popular approach is to mount a webcam in front of the meter, which captures the counters reading, and then using a specially designed software the numbers are extracted through image processing technology using OCR. Unfortunately, this method only works if the lighting is very even and high image quality, in other words: rarely in practice. Do you have one of the new electricity meters? the short »eHZ« (electronic Home counter) or Smart Meter, things are much easier. These Counters have an infrared diode on the front that shows the current counter readings pulse every few seconds without being asked.
Read head and signal converter:
The data is read out with an optical read head. Such a read head can be purchased (see Figure 1) or built yourself. The data is available as a serial signal and can be displayed and saved with minicom. The counter usually sends the data at 9600 baud, 8 bits without parity.
If you want it to be even more convenient, you can use an additional signal converter (see Figure 2). It picks up the serial signal from the optical read head (this is the upper cable) and provides the measurement data via HTTP. You can now easily read out the data with a browser or the curl command. For reasons of space, the command was distributed over two lines with \:
|
1 2 |
/ usr / bin / curl 192.168.2.10 \ -o /usr / local / shellscripts / consumption / sml. txt --max - time 10 |
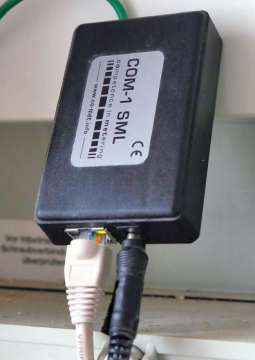
192.168.2.10 is the address of the signal converter, and after -o is the Path specified in which the data is stored for further processing. The Parameter –max-time 10 causes the curl to close the connection after a maximum of ten seconds. This is necessary because the signal converter provides a steady, unending stream of data. If you omitted –max-time, the command would last to run forever. One measurement per minute is sufficient for us for further processing. So it makes sense, automatically execute the curl command once a minute by the cron daemon allows. To do this, edit the crontab file with the command crontab -e and add the following statement, which is again spread over two lines:
|
1 2 |
* * * * * / usr / bin / curl 192.168.2.10 \ -o / usr / local / shellscripts / consumption / sml. txt --max - time 10 |
The Smart Message Language
You will now receive a fresh data record from the electricity meter once a minute. Unfortunately, you are not there yet, because you get a block of data all hexadecimal values that look something like this:
|
1 2 3 4 5 6 7 8 9 10 11 12 |
SML (1 B1B1B1B0101010176070012003CB67362006200726301017601010700 1200113 CD109080C2AEC2D4C5886010163CFC50076070012003CB674620062 0072630701770109080 C2AEC2D4C5886017262016500117A0E7977078181C7 8203 FF0101010104454D480177070100000009FF0101010109080C2AEC2D4C 58860177070100010800 FF63018201621E52FF56000014FDEF017707010002 0800 FF63018201621E52FF5600003ED1F60177070100010801FF0101621E52 FF56000014FDEF0177070100020801FF0101621E52FF5600003ED1F6017707 0100010802 FF0101621E52FF56000000000001770701000F0700FF0101621B 52 FF5500001DB60177078181C78205FF010101018302CE76D79A808753C7F4 B0A5799BEA8B017D95DCC2D4E8A2F25FB5998D20AA5C69754C8001FA564EDA 8 E532CA0BAD4BC85010101637ADD0076070012003CB6776200620072630201 7101632391000000001 B1B1B1B1A03DED0 ) |
Even if the mass of data seems unsorted at first, it is a chaos Method, because the data format is standardized. It’s called SML (Smart Message Language) and is distantly related to XML. A single block of data like that. The above is called an SML telegram. The good news is that the data that interests you – the reading of your utility meter are always in the same place within the SML telegram.
To find it, take another look at the display on your electricity meter. If the current meter reading is shown there, you will also see in the display the associated OBIS code.
As a rule it is “1.8.0”, which means “real work reference” in the OBIS language. You can find the code as 010800 in the SML telegram. That begins a sequence of bytes that contains the information relevant to us: 010800 FF63018201621E52FF56000014FDEF01. This can be broken down as follows:
01 08 00 the OBIS indicator
63 01 82 01 not relevant
62 1E the unit in which the output is made (1E = watt hours)
52 FF means that the value has a decimal point
56 from the next byte comes the count
00 00 14 FD EF There he is!
01 closes the counter reading
The counter reading is 14fdef in hexadecimal notation and in decimal. The spelling corresponds to 1375727. Since we know that the value in watt-hours (Wh) is shown with one decimal place, the current counter reading is 137572.7 watt-hours. Since energy is constantly needed somewhere in every household, this value will have risen after a short time. Want these changes we make visible.
RRDtool, Round Robin Database:
Now, Before we can automatically process the meter reading data, we still have to ask ourselves to deal with the RRDtool. The commands of the package of the same name help in the process of entering data into a round robin database and reading it out from there as well as to process graphics.
sudo apt – get install rrdtool
All kinds of numerical data can be stored in a round robin database Save: data throughput in bytes, counter, temperature, fan speed – the possibilities are almost endless. Unfortunately, the syntax is a bit bulky and not intuitive too understand. That’s why we want to explain how you can use a simple example RRDtool for your own purposes. We take the CPU temperature as an example of the Raspberry Pi. We’ll get them every five minutes, in one Save the RRD, and finally draw a history graph.
Create the round robin database (RRD):
A new RRD is created with the rrdtool create command. Other parameters determine how many data points the database records at which intervals and how they are consolidated over time. The following command creates an RRD suitable for taking temperature data (it’s a single line that has been broken several times for readability):
|
1 2 3 4 5 |
rrdtool create cputemp .rrd \ - step 300 \ DS: temp: GAUGE: 600: -20: 90 \ RRA: AVERAGE: 0.5: 12: 24 \ RRA: AVERAGE: 0.5: 288: 31 |
Let’s look at the command bit by bit:
- rrdtool create cputemp.rrd: The database is to be created and the name get cputemp.rrd.
- –step 300: Every 300 seconds (= five minutes) a temperature value should be added to the Database.
The next line that begins with DS is the properties of the data source described:
- DS: DS stands for Data Source.
- temp: This is the name of the data source. You can choose this name freely.
- GAUGE: The type of data source (DST). GAUGE means that the transferred numerical value – which may be positive or negative – saved unchanged becomes. Other types are COUNTER (stores the difference to the previous one Value), DERIVE (like COUNTER, but also with negative values) and ABSOLUTE ( indicates that the previous value always falls back to zero after reading).
- 600: This value is called Heartbeat. Actually there should be a value every 300 seconds written into the database. If a value is missing, it is accepted RRDtool also arrives later, but only up to a maximum 600 seconds late. Then the data point is saved as undefined in the Database entered.
- -20: 90: These are the minimum and maximum values that the database accepts. Since we are storing temperature data in this example, the range is between minus 20 and 90 degrees Celsius plausible. We’d try values outside Writing this area into the database would cause RRDtool to discard the values and save undefined instead.
The next two lines define how older data is consolidated (summarized) will:
- RRA: The keyword stands for Round Robin Archive.
- AVERAGE: Multiple data points are grouped by their mean is formed. Other possibilities here are MAX (the highest value is retained), MIN (lowest value) and LAST (last value).
- 5: 12: 24: Twelve data points are combined into one archive data point. In the RRDtool language, the original data points are called Primary Data points, or PDP for short, the consolidated data points Consolidated Data Points, CDP. At least half of the 12 PDPs (factor 0.5 – this is the so-called X-Files Factor, XFF) must be valid, i.e. not undefined. The last number means that there is space for 24 CDPs in this Round Robin archive.
The last line defines another round robin archive according to the same pattern for further consolidated data.
Enter values in the database:
So that we can write the CPU temperature to the database, we need it first determine. Fortunately, this is quite easy, because it is in the File / sys / class / thermal / thermal_zone0 / temp. This is what it looks like when you change the temperature simply display on the console:
|
1 2 3 |
cat / sys / class / thermal / thermal_zone0 / temp 58376 |
You can see that unfortunately a decimal point is missing: the actual value is 58.376 Centigrade. The following little bash script therefore divides the temperature by 1000 and shortens the output to only one decimal place (ensures scale = 1). The calculation is done with the command bc, which is done in advance with apt-get install bc must be installed. Then the script writes the temperature in the RRD cputemp.rrd that we just created:
|
1 2 3 4 5 6 7 8 9 10 11 12 13 14 15 |
#! / bin / bash # Cputemp .sh file # CPU temperature read out, format and save to a # Shorten the decimal place TEMP = $ (echo "scale = 1; $ (cat / sys / class / thermal / \ thermal_zone0 / temp) / 1000 "| bc -l) # write the determined value into the RRD rrdtool update cputemp .rrd N: $ TEMP |
Each entry in an RRD is given a time stamp. This timestamp consists of a number indicating the number of seconds since 01/01/2021. The N: in the rrdtool update line does the work for you to determine this timestamp. It stands for Now and automatically inserts the current time stamp. Our RRD expects a data point every five minutes, so we leave that Execute script in this interval via cron. The corresponding line in the crontab looks like:
|
1 |
* / 5 * * * * <path> / cputemp .sh |
Now the RRD is punctually supplied with a temperature value every five minutes.
Generate graphs:
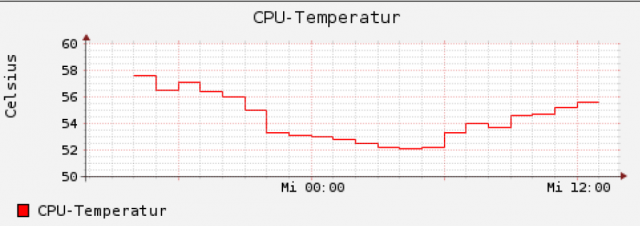
Use the rrdtool graph command to generate from the data in the database clear history graphs (see Figure 3). Take a look at the following Command, which in turn was distributed over several lines:
|
1 2 3 4 5 6 7 8 9 10 11 |
rrdtool graph cputemp. gif \ - start -24 h \ - title "CPU temperature" \ - vertical - label " Celsius" \ DEF: cputemperature = cputemp .rrd: temp: AVERAGE \ LINE1: cputemperatur # ff0000: "CPU temperature"; |
Let’s also look at this command step by step:
- rrtool graph cputemp.gif: A graphic with the name cputemp.gif is to be generated will.
- –start -24h: The starting point of the graph should be 24 hours in the past lie. RRDtool also accepts m for minutes as an abbreviation for the time units and d for days, –start -365 therefore creates a graph over a year.
- –title “CPU temperature”: The heading above the graphic.
- –vertical-label ” Celsius”: The labeling of the y-axis.
- DEF: cputemperature = cputemp.rrd: temp: AVERAGE: Here it is defined (DEF) from which Data source the graph is drawn. A variable name follows (cputemperature), which can be freely selected, followed by an equal sign and the file name of the RRD. This is followed by the name of the data source as it is in the DS section when the RRD was created, here also temp. Finally comes the consolidation function AVERAGE. It too must agree with what you specified when creating the RRD.
- LINE1: cputemperatur # ff0000: “CPU temperature”: This is about the appearance of the Graphs and the caption of the legend. LINE1 causes the graph to be saved as thin line is drawn. Alternatively there is LINE2 (thicker line) and AREA (filled area). The next field is the variable name that you entered after the Have assigned the DEF keyword.
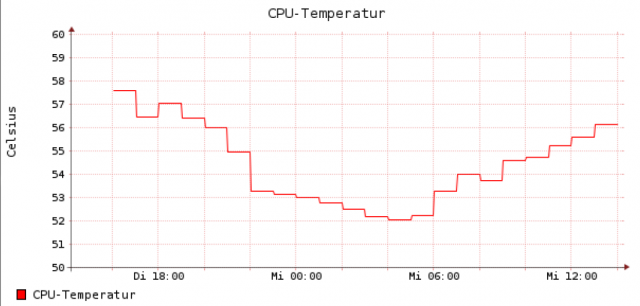
Immediately afterwards you set the color of the graph as a hexadecimal value. # ff0000 is a composite value from the basic colors red, green and blue. The intensity each of the three color values ranges from 0 to 255, which is 00 in hexadecimal notation to ff. In our example, the value for the color red has the maximum value ff, green and blue, on the other hand, have the value 00. As you can see in the picture, the result is a bright red line. The last field, “CPU Temperature”, is the text that appears below of the graph appears in the legend. If you don’t like the look of the graphic, there are still a few options To influence the design (see Figure 4). The following example changes the height and width of the graphic (-w 550 -h 220) and changes the colors of the Grid lines (GRID), the background (BACK) and the surrounding shading that ides a slight 3D effect.
|
1 2 3 4 5 6 7 8 9 10 11 12 13 14 15 |
rrdtool graph cputemp. gif \ -c GRID # ffffff00 -c BACK # ffffff \ -c SHADEA # ffffff -c SHADEB # ffffff \ - start -24 h \ - title "CPU temperature" --vertical - label " Celsius" \ -w 550 -h 220 \ DEF: cputemperature = cputemp .rrd: temp: AVERAGE \ LINE1: cputemperatur # ff0000: "CPU temperature"; |
The visual design of the graphic is of course highly personal Taste dependent. Take a few minutes and play along the different color values until the result suits you.
Save meter data and prepare graphs
Now we have all the requirements to cyclically display the data from the electricity meter (e.g. every 60 seconds) and generate a meaningful graph from it. The following listing shows an approach how you can do this with a simple bash script. This script is quite rudimentary and is intended for you only serve as a quarry of ideas, because depending on the model of your electricity meter and others You will certainly have to adapt it to your own needs. The script also doesn’t contain any error handling so it doesn’t get too complex becomes.
The example script assumes that the current SML telegram the line added at the beginning of the crontab in the file / usr / local / shellscripts /consumption / sml.txt is stored. It also relies on the previous RRDtools presented in section are installed. All relevant are there too Parameters of the RRDtool commands described.
In the first part of the script, the relevant bytes are cut out of the sml.txt, converted from hexadecimal to decimal notation and converted to correct unit (watt hours) brought. Then the RRD is created and filled (rrdtool update …), and finally several images are generated showing the course of the data series at certain intervals from the last four hours to over show the last year (rrdtool graph …).
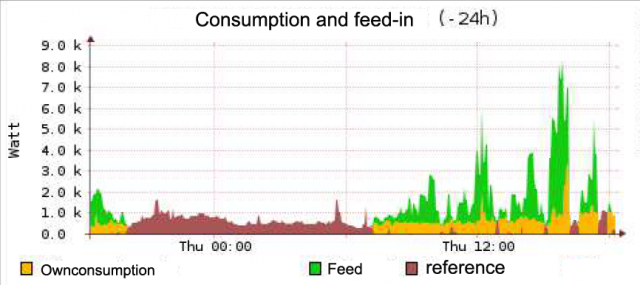
Each RRD can hold one or more data series. In our example it is four, in the listing they are named data1 to data4. Of course, you only need one at first Data series (for power consumption), but you may want more later Add measurement data, such as the feed-in power of a photovoltaic system. The pictures, the rrdtool generated from the data show the course of three data series over the last 24 hours (see Figure 5).
|
1 2 3 4 5 6 7 8 9 10 11 12 13 14 15 16 17 18 19 20 21 22 23 24 25 26 27 28 29 30 31 32 33 34 35 36 37 38 39 40 41 42 |
#! / bin / bash # File / usr / local / shellscripts / consumption / consumption .sh WDIR = / usr / local / shellscripts / consumption RRDDIR = $ WDIR / rrd IMGDIR = $ WDIR / images # Extract counter reading (the counter reading is in the # Bytes 285 to 294, must be adapted depending on the counter model) REFERENCE READING = $ (cat $ WDIR / sml. Txt | cut -b285 -294); Convert # to decimal numbers BZZDEZIMAL = $ (echo "ibase = 16; obase = A; $ REFERENCE REPORT" | bc); # Result in Wh BZZWH = $ (echo "scale = 4; $ BZZDEZIMAL / 10" | bc -l); echo "The current reference count is $ BZZKWH Wh." # Create RRD if it does not already exist if [-e $ RRDDIR / consumption. rrd]; then echo "OK, consuming. rrd exists."; else rrdtool create $ RRDDIR / consumption .rrd - step 60 \ DS: data1: GAUGE: 180: 0: U \ DS: data2: GAUGE: 180: 0: U \ DS: data3: GAUGE: 180: 0: U \ DS: data4: GAUGE: 180: 0: U \ RRA: MAX: 0.5: 1: 600 \ RRA: MAX: 0.5: 6: 700 \ RRA: MAX: 0.5: 24: 775 \ RRA: MAX: 0.5: 288: 797; echo "RRD created"; fi # Write data to the RRD rrdtool update $ RRDDIR / energy balance. rrd N: $ BZZWH: U: U: U; # Generate evaluation graphics for i in -4h -8h -24 h -7d -30 d -90 d -180 d -360 d; do rrdtool graph $ IMGDIR / consumption - $ i. gif \ -c GRID # ffffff00 -c BACK # ffffff \ -c SHADEA #ffffff -c SHADEB #ffffff \ - lazy --slope - mode - start $ i \ - title "Consumption ($ i)" --vertical - label "Watt" \ -w 750 -h 150 \ DEF: data1 = $ RRDDIR / consumption. rrd: data1: AVERAGE \ AREA: data1 # aa5555: "Consumption"; done 913 |
Discover more from Electronic Clinic
Subscribe to get the latest posts sent to your email.