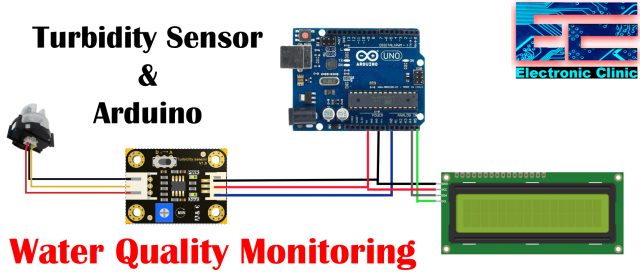
Turbidity Sensor with Arduino for Water quality monitoring, Turbidity Meter
Last Updated on August 17, 2024 by Engr. Shahzada Fahad
Table of Contents
Turbidity Sensor with Arduino, Overview:
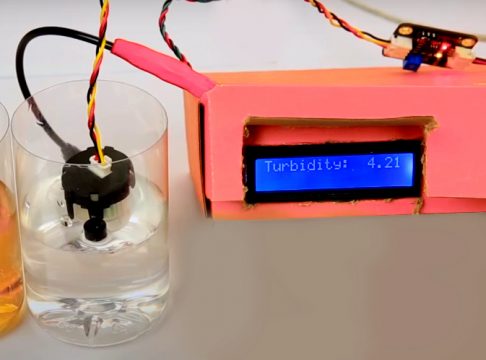
In this tutorial, we’re going to be looking into this turbidity sensor released by DFrobot. We will be making a low cost water turbidity meter based on the Arduino, Turbidity Sensor, and the I2C LCD. I will cover the Analog and digital modes of the Turbidity sensor. I will also explain how to calibrate the Turbidity sensor if in case you get the wrong values.
You can also ready my article on IoT based Water level monitoring and automatic water pump control system using the ESP32 WiFi + Bluetooth Module, Waterproof Ultrasonic Sensor, and the New Blynk V2.0 more…

This mechanism is relatively simple as light will be blocked by particles suspending in the liquid.
The turbidity can be measured by detecting the amount of light going through the liquid sample.

The turbidity unit is measured in NTU “Nephelometric Turbidity Units” which is global standard. The larger the turbidity is, the cloudy of the sample is. Turbidity sensor connects to the microcontroller through an analog to digital converter through this A to D converter.

The output signal can be switched between analog and digital. Under analog mode the signal wire from A to D converter goes to the analog input pin on the microcontroller. The turbidity is represented by the voltage of the output pin.
Clear water with NTU less than 0.5 give us a voltage around 4.1 volts.
NTU: 500 Voltage: 3.27V
NTU: 50 Voltage: 4.10V
NTU: 0.5 Voltage: 4.21V
The larger the turbidity is, the smaller this output voltage will be. The voltage ranges from 0 to 4.5 volts. Under digital mode the signal wire from the converter goes to the digital pin of the microcontroller the sensor sends out a 5v signal when turbidity reaches a threshold value. This value can be adjusted by the on board potentiometer on the A & D converter. Turbidity sensor is often used in water quality monitoring.
In my previous articles, I covered
Water quality monitoring using Ph Sensor and Arduino
IoT based Water Quality Monitoring Using Ph Sensor and ESP8266
Water Quality Monitoring using TDS sensor and Arduino
IoT Water Quality Monitoring using TDS sensor and ESP32
Amazon Purchase Links:
Arduino Nano USB-C Type (Recommended)
DFrobot Water Turbidity Sensor:
Commercial Water Turbidity Meter approved by ISO 7027 and EPA:
*Disclosure: These are affiliate links. As an Amazon Associate I earn from qualifying purchases.
What is Water Turbidity- Dangers of Cloudy River and Drinking Water?
Water turbidity is an important measuring unit to determine water quality and describes the degree of water cloudiness.

Turbidity is caused by a huge number of small particles that are suspended in water and invisible to the human eye. While bigger particles are settling down rapidly, small particles – also known as colloids – are settling down very slowly or not at all.
Turbidity in rivers or lakes is often caused by human activities like construction, mining and agriculture. Storm water runoff after a rainfall can wash up sediments from urbanized areas, industries and farmland.

Suspended particles absorb heat from the sunlight and lead to water temperature increase. Also, a high turbidity scatters the light so that photosynthetic activity at deeper water levels is minimized. Both reduces the amount of oxygen which causes a decrease of aerobe microorganisms and deterioration of the self-cleaning effect of water.

Turbidity in drinking water and tap water can cause diseases because viruses or bacteria can be attached to suspended solids. Even disinfectants such as chlorine or UV sterilization have only limited success at high turbidity levels. This is because suspended solids interfere with the disinfectants and act as shields for viruses and bacteria.

Tap water travels through miles of water supply pipes and can pick up cloudiness due to broken or dirty pipes. The WHO (World Health Organization) published that the turbidity of tap water should ideally be below 1 NTU. If you are unsure about the quality of your tap water, you can test it with a turbidity meter. This is what, this article is all about. We will design our own Water Turbidity Meter.
In wastewater treatment plants flocculants and coagulants are dosed to water with high turbidity. They alter electrical charges of particles so that they clump together and form bigger particles. The bigger particles are then settled down in sedimentation basins which are often equipped with lamella clarifiers for enhanced particle settling.
As you should learnt that the suspended particles in the water scatters the light. So we will use this to measure the water turbidity.
Turbidity Meter or Turbidity Sensor Working:

Turbidity measurement not only depends on the turbidity standard but also on the light source.

ISO 7027 stipulates an infrared source which lies in the non-visible wavelength range since colors only occur in the visible range the infrared measurement is not influenced by the medium’s color.

turbidity measurement according to US-EPA 180.1, uses white light in the visible range the turbidity units differ depending on the selected method for measurement according to ISO the defined units are formizine nephelometric unit or formazine attenuation unit for measurement according to EPA the unit is nephelimetric turbidity unit.
The most widely used measurement methods for turbidity are,
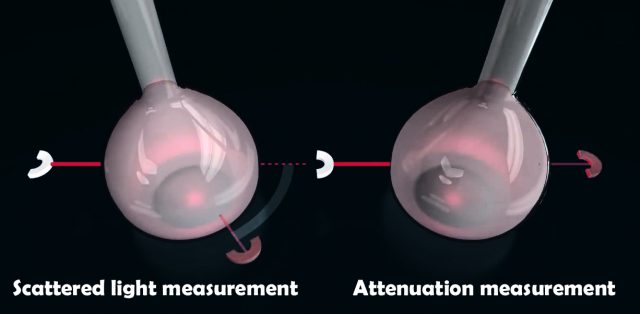
- Scattered light measurement
- Attenuation measurement
First let’s take a closer look at scattered light measurement.
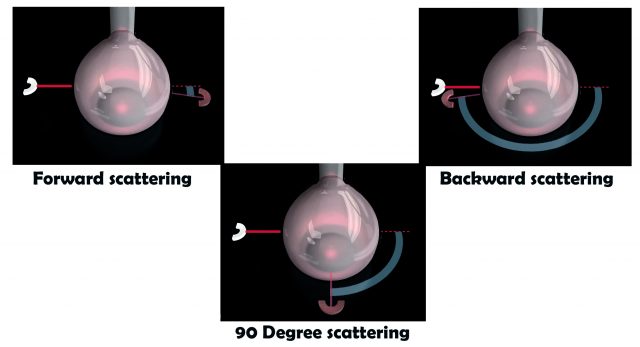
Using this method either the forward scattering or backward scattering or the 90 degree scattering is measured. The standard method according to ISO7027 and EPA 180.1 is the 90 degree measurement.

Here the detector is positioned at a right angle from the light source to measure the light scattered to 90 degrees from the incident light. This method is suitable for low turbidity values in applications with higher turbidity values. Sensors are used that measure back scattering at 135 degrees, for example, very turbid media contain so many particles that the main part of the light beam is back scattered, this means differences in turbidity can be detected much better in the back scattered light sensors that are equipped with four detectors measuring at 90 degrees and 135 degrees are able to cover a wide measuring range.
Now let’s take a look at the attenuation measurement also described in ISO 7027 here again a light beam is radiated through the medium. However in contrast to the scattered light methods the transmitted light is measured, because the detector is positioned in one line with a light source. This method is suitable for average to high turbidity values, because it delivers definite results and offers high reproducibility.

The signal curve of turbidity sensors depends on the method used when using scattered light measurement the signal curve rises up to a certain particle density because the light is scattered towards the detector. When the particle density increases further, the measuring signal weakens again, because the light is scattered so strongly that the radiation no longer reaches the detector. That’s why; scattered light measurement does not always deliver clear results. This phenomenon does not occur with attenuation measurement; here the signal consistently weakens with increasing turbidity.
Now, after explaining the very basics, now it’s time to start working on the Water turbidity meter. Thanks to the DFrobot for making this amazing low-cost water turbidity sensor.
Turbidity Sensor Working Principle:
The working principle of the turbidity sensor– When light passes through a certain amount of water, the amount of light penetration depends on the amount of dirt in the water. As the amount of dirt increases, the light that penetrates the water sample decreases, and the turbidity sensor measures the amount of light transmitted to calculate the turbidity of the wash water. Inside the sensor is an infrared pair tube. When light passes through a certain amount of water, the amount of light transmitted depends on the degree of contamination of the water. The dirtier the water, the less light is transmitted.
Turbidity Sensor Specification:
Operating Voltage: 5V DC
Operating Current: 40mA (MAX)
Response Time: <500ms
Insulation Resistance: 100M (Min)
Output Method: Analog and Digital
Analog output: 0-4.5V
Digital Output: High/Low-level signal (you can adjust the threshold value by adjusting the potentiometer)
Operating Temperature: 5℃~90 ℃
Storage Temperature: -10℃~90℃
Weight: 30g
Adapter Dimensions: 38mm28mm10mm/1.5inches 1.1inches0.4inches
Turbidity Sensor Applications
- Washing machines,
- Dishwashers,
- industrial site control,
- environmental sewage collection
- Water quality monitoring using IoT
- Oil quality monitoring
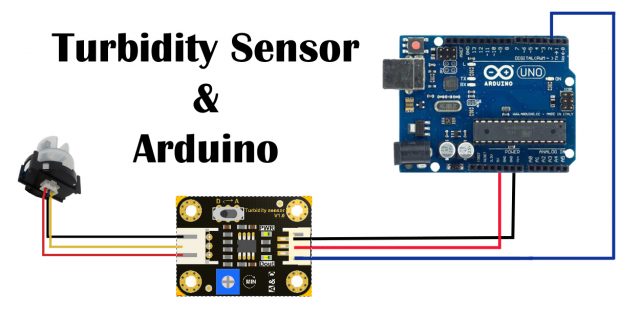
Turbidity Sensor Interfacing with Arduino “Analog Mode”:

This is the very basic circuit diagram explaining how the turbidity sensor is connected with the Arduino through the A & D “Analog to Digital convertor”. The power pins of the A & D circuit are connected with the Arduino’s 5V and GND pins while the Dout pin of the convertor circuit is connected with the Analog pin A0 of the Arduino. These are the minimum connections you can do for checking the Turbidity sensor. I recommend this circuit for the beginners. You can connect the Arduino with the computer and then open the serial monitor to check the values. While using the Turbidity sensor in the analog mode, make sure the signal mode is set to A.
Turbidity Sensor Arduino code “Analog Mode”:
You can start with the following code. This program reads the Arduino’s analog pin A0 to which the Turbidity sensor is connected. This program simply converts the analog signal into the voltage. From this voltage we can decided if the water under test is clean or have impurities in it.
|
1 2 3 4 5 6 7 8 9 |
void setup() { Serial.begin(9600); //Baud rate: 9600 } void loop() { int sensorValue = analogRead(A0);// read the input on analog pin A0: float voltage = sensorValue * (5.0 / 1024.0); // Convert the analog reading (which goes from 0 - 1023) to a voltage (0 - 5V): Serial.println(voltage); // print out the value you read: delay(500); } |
After uploading the above program. Simply open the Serial monitor, select the desired baud rate 9600. You should be able to see the voltage. If you can read the voltage then congrats you have successfully done it. Now you can continue with the testing. Go ahead select different liquids or you can fetch clean water dip the turbidity sensor and start adding mud or sand and you will see change in the voltage.
Turbidity Sensor Interfacing with Arduino “Digital Mode”:
This time the signal mode switch is set to D and the Dout is connected with the Arduino’s digital pin D2. Now using the potentiometer “the Blue color thing” you can set a threshold value. So when the turbidity sensor value will increase or decrease than the threshold value, an output signal of 5V will be fed to the Arduino’s digital pin D2. So, at any given time, the Arduino will get 0 or 5V as the signal. Using this 0 and 5V information then you can turn ON and turn OFF some buzzers, or you can activate other circuits, you can switch ON 220Vac light bulbs, or you can turn ON a Water pump, etc. It’s totally up to you. For demonstration purposes, I will control the onboard LED available on pin 13.
Turbidity Sensor Arduino code “Digital Mode”:
|
1 2 3 4 5 6 7 8 9 10 11 12 13 14 15 16 17 18 19 |
int ledPin = 13; // Connect an LED on pin 13, or use the onboard one int sensor_in = 2; // Connect turbidity sensor to Digital Pin 2 void setup(){ pinMode(ledPin, OUTPUT); // Set ledPin to output mode pinMode(sensor_in, INPUT); //Set the turbidity sensor pin to input mode } void loop(){ if(digitalRead(sensor_in)==LOW){ //read sensor signal digitalWrite(ledPin, HIGH); // if sensor is LOW, then turn on } else { digitalWrite(ledPin, LOW); // if sensor is HIGH, then turn off the led } } |
Upload the above code and make sure the Dout wire from the A & D converter is connected with the Arduino’s Digital pin D2. The LED will turn ON and Turn OFF depending on the water purity. Start with clean water and start adding mud and you will see when the turbidity value will cross the threshold value the LED state will be changed. Of course, you can replace this led with a relay to control a pump or a buzzer to let you know.
So, now after covering the very basics, now it’s time to take this project to another level. This time we will display the water turbidity sensor values on the I2C LCD. This way you won’t need a laptop and you can monitor the values in real-time.
Water Quality Monitoring Using Turbidity Sensor and Arduino Circuit Diagram:
For real-time monitoring set the signal mode switch to A ”Analog”. Connect Dout with the Analog pin A0. For displaying the values you can use I2C 16×2 LCD to reduce the wiring. You can also use a regular 16×2 LCD but this will need more wires. So my recommendation is the I2C LCD. In Arduino SCL is A5 and SDA is A4. So, connect the SCL and SDA pins of the I2C 16×2 LCD with the Arduino’s pins A5 and A4 respectively. If you want to further reduce the size then you can also use I2C Oled Display Module. Anyhow, I will continue with the I2C 16×2 LCD.
Water Quality Monitoring using Turbidity Sensor Arduino Code:
Before, you start the programming; first of all, make sure you download all the necessary libraries. You will need the Wire.h and LiquidCrystal_I2C.h libraries.
|
1 2 3 4 5 6 7 8 9 10 11 12 13 14 15 16 17 18 19 20 21 22 23 24 25 26 27 |
/* Download Libraries: https://www.electroniclinic.com/arduino-libraries-download-and-projects-they-are-used-in-project-codes/ */ #include <Wire.h> #include <LiquidCrystal_I2C.h> LiquidCrystal_I2C lcd(0x27,16,2); //0x27 is the i2c address, while 16 = columns, and 2 = rows. void setup() { pinMode(A0, INPUT); lcd.init(); //Init the LCD lcd.backlight(); //Activate backlight lcd.home(); } void loop() { int sensorValue = analogRead(A0);// read the input on analog pin A0: float voltage = sensorValue * (5.0 / 1024.0); // Convert the analog reading (which goes from 0 - 1023) to a voltage (0 - 5V): lcd.clear(); lcd.setCursor(0,0); lcd.print("Turbidity:"); lcd.setCursor(0,1); lcd.print(voltage); delay(500); } |

Turbidity Sensor calibration:
After uploading the above code. Simply turn ON your Arduino and you should be able to see something on the LCD. Now you can start with clean water. If the value on the LCD is 4.2 or 4.21 then there is no need to calibrate the sensor it’s working great. But, if you are getting a different value on the LCD then you will need to calibrate the Turbidity Sensor by adjusting the potentiometer available on the A & D converter circuit. Rotate the knob till you see a value of 4.2 or 4.21 and you are all set.
A graph from the DFrobot shows the relation between the NTU ”turbidity” and the voltage.

As per the above chart, you can map the voltage values in terms of NTU values. This way you can display the voltage value along with the NTU value on the LCD. I am sure you know about the Arduino map() function? if not then you can read about the Arduino map() function.
Turbidity Sensor Voltage into NTU:
The voltage range you can see is from 0 to 4.5 and the NTU values from 0 to 3500, now all you need is to map the 0 to 4.5 voltage range to 0 to 3500 which is the easiest way. Or you can use the 2nd method which is a bit hard and we are going to implement this.
At the bottom of the graph, you can see this formula
Y = -1120.4x2 + 5742.3x – 4352.9
Where x is the voltage, and I already explained how to measure the Turbidity sensor voltage
float voltage = sensorValue * (5.0 / 1024.0);
this line of code gives you the voltage.
Let’s say
Turbidity_Sensor_Voltage = Y
Then we can use the following formula to convert the turbidity sensor Voltage value into NTU value. In the Arduino code we will simply write
ntu = -1120.4square(Turbidity_Sensor_Voltage) + 5742.3Turbidity_Sensor_Voltage – 4352.9;
So, using the above formula we can convert the Turbidity Sensor voltage value into the NTU value without putting a lot of effort. Let’s take a look at the final code.
|
1 2 3 4 5 6 7 8 9 10 11 12 13 14 15 16 17 18 19 20 21 22 23 24 25 26 27 28 29 30 31 32 33 34 35 36 37 38 39 40 41 42 43 44 45 46 47 48 49 50 51 52 53 54 55 56 57 58 59 60 61 62 63 64 65 66 67 68 69 |
/* * Arduino Turbidity Meter, Water Quality monitoring * Download Libraries * https://www.electroniclinic.com/arduino-libraries-download-and-projects-they-are-used-in-project-codes/ * */ #include <Wire.h> #include <LiquidCrystal_I2C.h> LiquidCrystal_I2C lcd(0x27,16,2); //0x27 is the i2c address, while 16 = columns, and 2 = rows. int Turbidity_Sensor_Pin = A0; float Turbidity_Sensor_Voltage; int samples = 600; float ntu; // Nephelometric Turbidity Units void setup() { Serial.begin(9600); // for debugging purposes pinMode(Turbidity_Sensor_Pin, INPUT); lcd.init(); //Init the LCD lcd.backlight(); //Activate backlight lcd.home(); } void loop() { Turbidity_Sensor_Voltage = 0; /* its good to take some samples and take the average value. This can be quite handy * in situations when the values fluctuates a bit. This way you can take the average value * i am going to take 600 samples */ for(int i=0; i<samples; i++) { Turbidity_Sensor_Voltage += ((float)analogRead(Turbidity_Sensor_Pin)/1023)*5; } Turbidity_Sensor_Voltage = Turbidity_Sensor_Voltage/samples; // uncomment the following two statments to check the voltage. // if you see any variations, take necessary steps to correct them // once you are satisfied with the voltage value then again you can comment these lines //Serial.println("Voltage:"); //Serial.println(Turbidity_Sensor_Voltage); Turbidity_Sensor_Voltage = round_to_dp(Turbidity_Sensor_Voltage,2); if(Turbidity_Sensor_Voltage < 2.5){ ntu = 3000; }else{ ntu = -1120.4*square(Turbidity_Sensor_Voltage)+ 5742.3*Turbidity_Sensor_Voltage - 4352.9; } lcd.clear(); lcd.setCursor(0,0); lcd.print(Turbidity_Sensor_Voltage); lcd.print(" V"); lcd.setCursor(0,1); lcd.print(ntu); lcd.print(" NTU"); delay(10); } float round_to_dp( float in_value, int decimal_place ) { float multiplier = powf( 10.0f, decimal_place ); in_value = roundf( in_value * multiplier ) / multiplier; return in_value; } |
For video tutorials visit my YouTube channel “Electronic Clinic”.
Discover more from Electronic Clinic
Subscribe to get the latest posts sent to your email.


Hi, I copied the code for using a lcd, and it loads Ok, but I keep getting a negative NTU value, say at 4.34 volts, as an example. How do I correct this ?
What is the purpose of the small pot inside the actual sensor? Not the same pot as on the A&D board.